
Our Global High Yield capability is 10 years old. Since the capability’s inception a decade ago, the global high-yield market has transformed beyond recognition. Not only has it doubled in size, but the number of issuers – and the average size of an issue – have also soared.
The composition of the market has also changed. Difference sectors have developed clout, while post-financial-crisis regulations means new instruments have emerged and capital structures have deepened. The market has also globalised, while environmental, social and governance (ESG) factors have gained prominence.
To find out more about changes in the high-yield credit market, watch our video.
Coming of age: 10 key changes in the high-yield market over the past decade.
Podcast: A decade of change in global high yield
In episode 12 of Delta, Andrew ‘Jacko’ Jackson, Head of Fixed Income, and Fraser Lundie, Head of Credit, outline the 10 developments in the high-yield market (as highlighted in the above video) before focusing on the most impactful shifts . They also consider what the high-yield market offers active investors in the current environment.
Global High Yield Strategy performance
The strong performance of our Global High Yield Strategy since its inception has been driven by our dynamic approach to global credit, which focuses on relative-value investing across the capital structures of global issuers.
To achieve this, we combine top-down allocation across the global liquid-credit spectrum with bottom-up, high-conviction security selection that is enhanced by ESG analysis.
Figure 1. Net strategy performance v peer group median
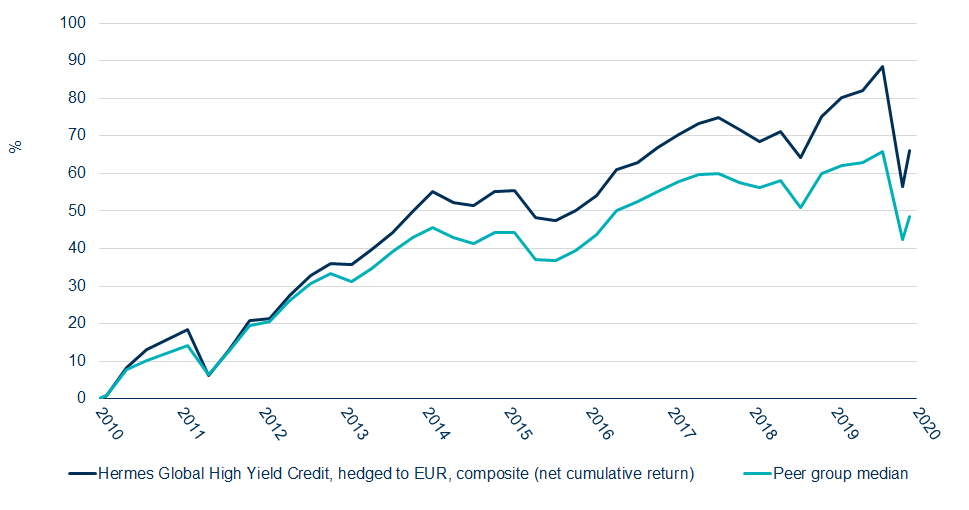
Figure 2. Gross strategy performance v benchmark
1 year | 3 years (per annum) | Five years (per annum) | Since inception (per annum) | |
|---|---|---|---|---|
Global High Yield Credit Strategy | -6.19 | 0.19 | 1.75 | 5.98 |
Benchmark | -7.00 | -0.94 | 1.26 | 4.88 |
Figure 3. Gross rolling-year performance
31/04/2019-31/04/2020 | 31/04/2018-31/04/2019 | 31/04/2017-31/04/2018 | 31/04/2016-31/04/2017 | 31/04/2015-31/04/2016 | |
|---|---|---|---|---|---|
Global High Yield Credit Strategy | -6.19 | 4.52 | 2.58 | 10.32 | -1.71 |
Source: Federated Hermes, as at 30 April 2020. Performance shown is in euros gross of fees from 1 June 2010. Inception date 1 June 2010.
Past performance is not a reliable indicator of future returns
Data is supplemental to the GIPS® compliant information that follows.
The value of investments and income from them may go down as well as up, and you may not get back the original amount invested. Any investment overseas may be affected by currency exchange rates.
Hermes Global High Yield
GIPS® Composite
Composite: Hermes Global High Yield Credit Hedged to EUR
Creation date: 09 August 2010
Inception date: 01 June 2010
All information is quoted in EUR
Year | Gross of Fees Return | Net of Fees Return | Benchmark Return | Composite 3-Yr St Dev (%) | Benchmark 3-Yr St Dev )%) | No of Portfolios | Composite Dispersion | EUR Total Composite Assets (Million) | % Total Firm Assets |
|---|---|---|---|---|---|---|---|---|---|
2018 | -5.5 | -6.1 | -4.7 | 4.2 | 4.3 | <5 | – | 314 | 1.1 |
2017 | 8.0 | 7.3 | 5.8 | 4.9 | 5.4 | <5 | – | 455 | 1.6 |
2016 | 11.2 | 10.5 | 14.3 | 5.2 | 5.8 | <5 | – | 480 | 1.8 |
2015 | -1.9 | -2.5 | -3.6 | 4.9 | 5.3 | <5 | – | 247 | 1.0 |
2014 | 5.5 | 4.8 | 1.9 | 4.4 | 4.6 | <5 | – | 240 | 0,7 |
2013 | 9.6 | 8.8 | 6.3 | 9.2 | 6.6 | <5 | – | 170 | 0.6 |
2012 | 18.4 | 17.5 | 16.8 | – | – | <5 | – | 155 | 0.6 |
2011 | 0.7 | -0.1 | 3.8 | – | – | <5 | – | 131 | 0.5 |
2010* | 13.5 | 13.0 | 10.1 | – | – | <5 | – | 130 | 0.5 |
*Partial year returns for Composites and Benchmark
Hermes Fund Managers Limited claims compliance with the Global Investment Performance Standards (GIPS®) and has prepared and presented this report in compliance with the GIPS® standards. Hermes Fund Managers Limited has been independently verified for the periods 1 January 1998 through 31 December 2018. The verification report is available upon request. Verification assesses whether (1) the firm has complied with all the composite construction requirements of the GIPS® standards on a firm-wide basis and (2) the firm’s policies and procedures are designed to calculate and present performance in compliance with the GIPS® standards. Verification does not ensure the accuracy of any specific composite presentation.
For the purposes of compliance with GIPS®, the firm is defined as Hermes Fund Managers Limited (“Hermes”), an asset management group consisting of a number of subsidiary or affiliate companies. As of 31 December 2009 the Hermes Fund Managers Limited firm definition was broadened to better represent the full range of investment strategies offered. Hermes Investment Management is the brand name for the Hermes group including Hermes Fund Managers Limited. Information about changes is available upon request. Gross of fees returns have been calculated gross of management, custodial fees and reclaimable withholding taxes, but after all trading commissions.
The composite includes all discretionary portfolios following the Global High Yield Bonds Hedged to EUR strategy run by the Hermes Credit team and has an inception date of 1 June 2010. The objective of the strategy is to exceed the return of the benchmark by at least 1.5% per annum over a three year period. The strategy may invest in a broad range of assets, either directly or through the use of derivatives, (including, but not limited to, equities, equity-related securities, eligible CIS and/or financial indices, futures, options, swaps, debt, fx and money markets). The strategy through its investments in FDIs may be leveraged. From 1 February 2016 the composite’s benchmark is the Merrill Lynch Global High Yield Constrained Index hedged to EUR, which is designed to measure the debt market performance of global high yield debt. The benchmark contains primarily USD and EUR issues. Previously the benchmark was Merrill Lynch Global Non-Financials High Yield Constrained 2% Index hedged to EUR from inception to COB 31 January 2016. The benchmark was changed to provide a better representation of the evolving investment strategy applied to the underlying constituent portfolios. Performance is shown in EUR. The composite base currency is EUR.
Since inception the management fee schedule for this strategy was 0.75% per annum. As of 1 January 2014 the management fee schedule for this strategy is 0.65 % per annum.
The standard fees are shown in Part 2A of its Form ADV. For historical fees, please contact Hermes. Net results reflect the above-mentioned fee schedules, actual results may vary for each individual portfolio.
Composite descriptions, along with additional information regarding policies for valuing portfolios, calculating performance, and preparing compliant presentations are available upon request. Where appropriate, composite dispersion is calculated as the asset weighted standard deviation of the annual returns of the constituent portfolios. If a composite consists of less than five portfolios for the full year then no measure of dispersion is shown. The three year annualised standard deviation measures the variability of the composite and benchmark returns over the preceding 36 month period. Standard deviation measures are not shown where there are less than 36 monthly observations available. Standard deviation measures are not required for periods prior to 2011.
What lies ahead for the global high-yield market?
The coronavirus pandemic is disrupting the corporate landscape and we believe the high-yield market is set to evolve even further in the months and years ahead. With dividends in doubt amid the market sell-off, income-seeking investors are increasingly turning to high-yield credit as a source of income.
While some argue this is a short-term phenomenon, we believe that the dividend crisis may be the start of a more structural change. The rising prominence of ESG factors means that companies are under increasing pressure to invest sustainably. As a result, dividends and share buybacks will likely be under pressure even when the coronavirus crisis eases.
A key beneficiary of this should be high-yield credit: as an asset class that is contractually obliged to pay coupons, it has the potential to deliver more upside during the recovery periods following market drawdowns.
Interest rates have been slashed to close to zero and are likely to remain at record lows. In this environment, we believe that income will be in demand – something that global high-yield credit is uniquely positioned to offer.