For illustrative purposes only and not representative of any specific investment.
Past performance is no guarantee of future results.
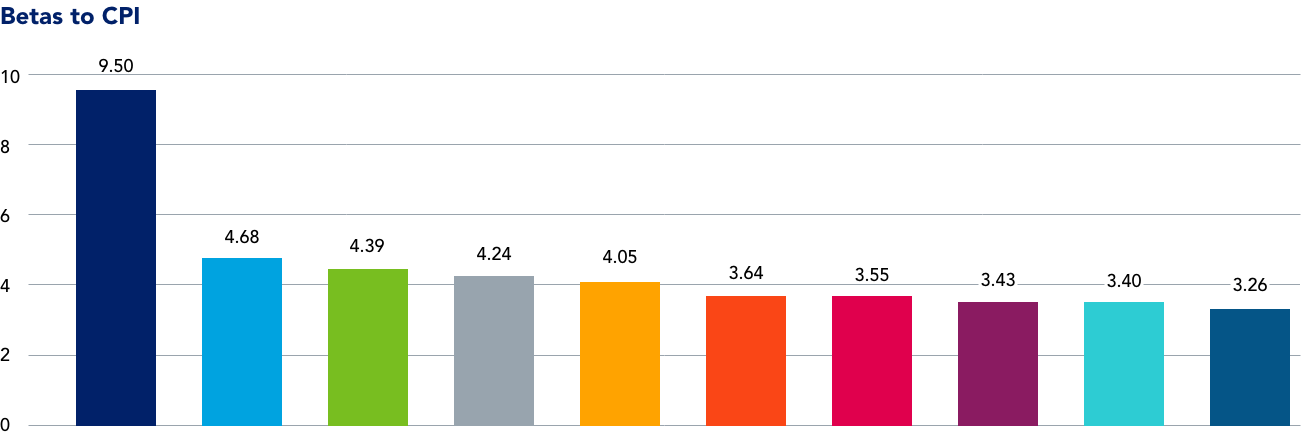
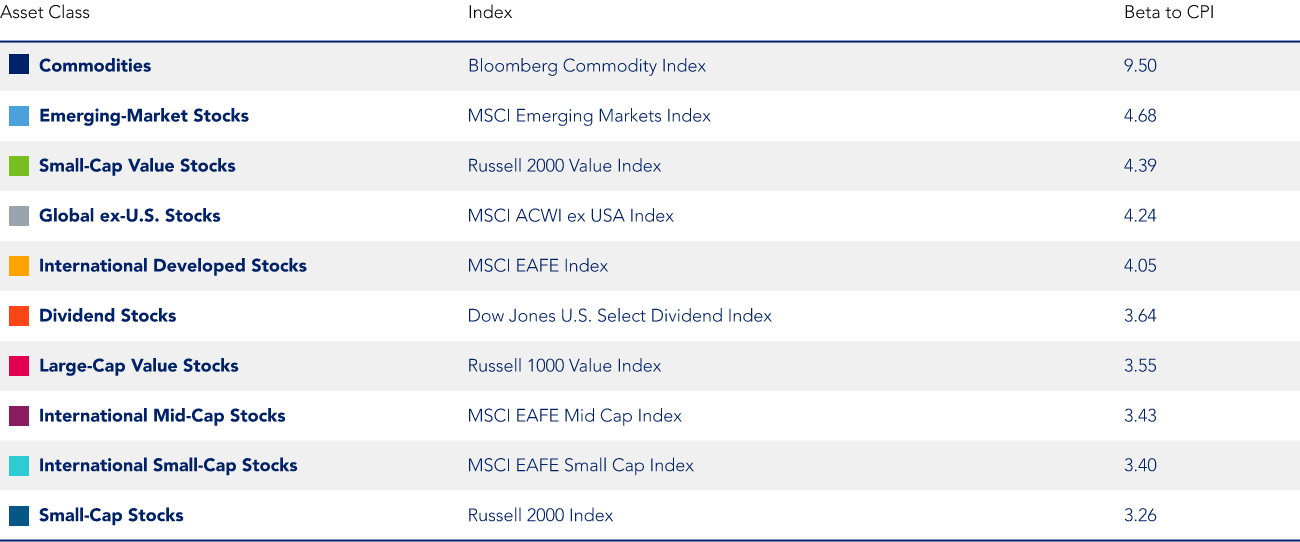
Inflation beta is a measure of the responsiveness of an asset class’s (represented here by the indicated indexes) returns to changes in inflation. Instead of calculating the risk of a stock to the overall market, this beta calculation reflects the risk of the asset class to CPI. For example, beta of 1.1 would indicate that if there were a 1% change in the CPI, the index would change 1.1% (or 10% better in times of inflation and 10% worse in times of deflation). Higher betas indicate higher risk to CPI, and potentially a better hedge in times of inflation. The beta is calculated using the year-over-year changes of both the seasonally adjusted CPI and each representative asset class index. The underlying data utilized for this analysis ranges from 1/31/01 to 4/12/22 (YOY returns from 1/31/02 to 4/12/22).
For additional information, including definitions of related terms and indexes, see the Financial Glossary and Benchmark Index Glossary.