

After the bounce: improving world economy flashes mixed messages
Global and emerging markets have rallied 68% and 70%, respectively, since the March 2020 lows. The Joe Biden victory in the US election followed by the announcement of several highly effective vaccine candidates buoyed market hopes late in the year of a sustained economic recovery after the initial V-shaped bounce. Today we examine key indicators to assess whether the macro data supports an emerging markets (EM) recovery against a backdrop of improving world conditions.
Sentiment improved in the latest survey as imminent vaccine roll-outs boosted consumer confidence that the US would soon exit the Covid-19 pandemic.
Figure 1. The state of the US consumer
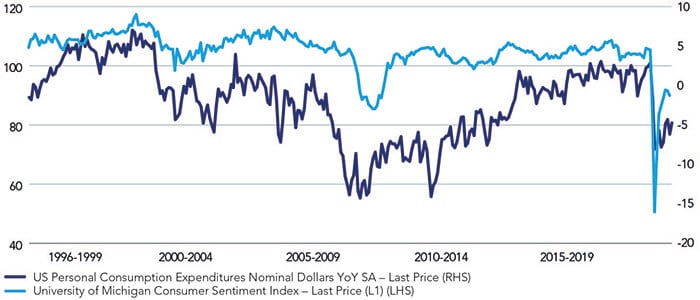
Source: Bloomberg, as at December 2020.
But a couple of factors could moderate the growing upbeat mood, including:
- a growing partisan divergence in economic outlook with Democrats becoming optimistic compared to Republicans;
- an unexpected fall in confidence in November as Covid-19 infections rose; and,
- deteriorating financial conditions for lower-income households which experienced a fall in income – something that last occurred in March 2014.
The data suggests still-fragile consumer sentiment will likely remain subdued until there is a clear path out of the pandemic (subject to the roll-out of the vaccines) combined with timely financial support to repair the economic damage.
Figure 2. German business sentiment
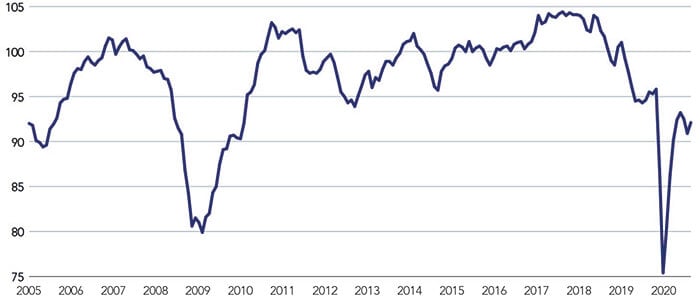
Source: Bloomberg, as at 31 December 2020.
German business morale improved in December after falling for the second month in a row in November. The country has seen rising uncertainty surrounding the spread of the virus as curbs on economic activity hit the service sector. While the German economy is resilient the recently imposed hard lockdown will likely prevent the economy from operating at full potential.
Figure 3. Japan manufacturing momentum
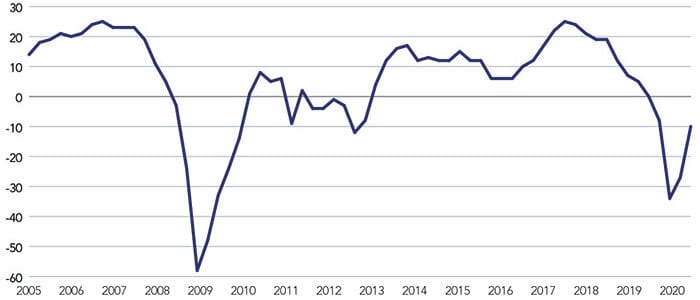
Source: Bloomberg, as at December 2020.
Business sentiment in Japan improved following the slump in the June quarter. Exports to the US and China boosted conditions for large manufacturers although coronavirus fears muted the mood in the service sector amid restrained domestic consumer activity.
Despite the recent improvement the sentiment index remains in negative territory and below pre-Covid-19 levels. Meanwhile, the government announced a US$708bn stimulus program, boosting spend on low-carbon initiatives and digital technologies.
Figure 4. China fixed asset investment trajectory
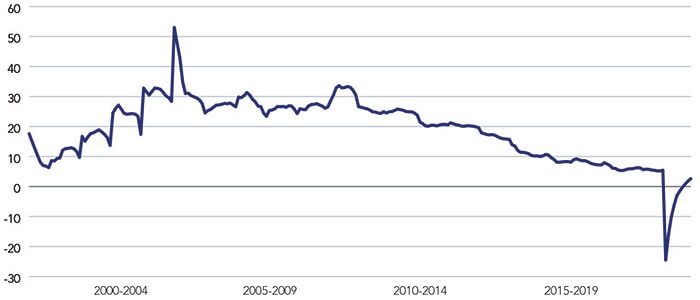
Source: Bloomberg, as at December 2020.
In addition to consumption, fixed asset investment (FAI) is one of the vital drivers of the Chinese economy. Over 2020 the overall FAI in China rose slightly, albeit spurred mainly by the property sector (up 6.8%) with investment in both manufacturing and mining falling 9% and 3.5%, respectively, in the same period. Chinese authorities commonly boost property investment as a short-term tactic to shore up the economy.
Although China has bounced back to pre-Covid levels, lower-income households have seen a drop in their wealth levels in contrast to their wealthier counterparts who reported gains.
Fiscal stimulus to the rescue: why governments must target spending to save economies
According to the International Monetary Fund (IMF), the G20 provided US$12tn in budgetary and liquidity support to cushion the economy during the pandemic. The scale of the financial support has ensured a sharp V-shaped recovery.
However, the recovery pace has been uneven with evidence of rising inequality, possibly requiring additional targeted fiscal stimulus. Recently, lawmakers in the US agreed on a US$900bn stimulus package that will provide $600 to individuals earning $75,000 or less in annual income as well as relief such as rental assistance, funds for small businesses and aid to troubled sectors. Elsewhere, Japan recently announced US$708bn worth of financial support, including spending on low-carbon and digital initiatives.
Of course, something is always better than nothing but the stimulus package probably comes a little late to reverse the economic damage already done to lower-income households and businesses forced to lay off workers. The incoming Biden administration will likely need a much larger and targeted spending plan to breathe life back into the US economy.
But according to European Commission and IMF estimates, general government deficits should moderate in 2021.
Figure 5. General government deficit and gross debt expected in 2020 and 2021 (% of GDP)
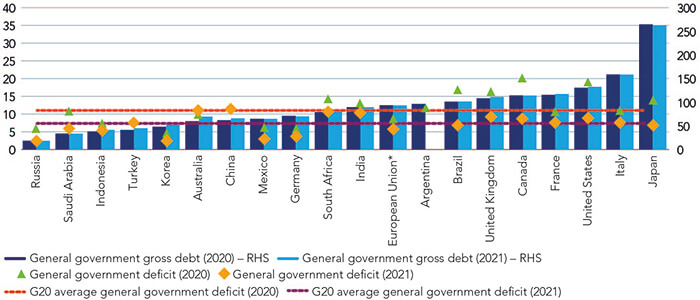
Source: European Commission Autumn 2020 Economic Forecast, IMF World Economic Outlook database. Notes: The general government deficit-to-GDP ratio is measured on the left axis, whilet he general government gross debt-to-GDP is measured on the right axis (RHS). *The EU aggregate is formed by the aggregation of the country data in euro, with consolidation where appropriate.
Many governments will need to reduce deficits to ensure debt-to-GDP ratios remain at sustainable levels.
Clearly, falling deficits imply that the scale of fiscal support in 2021 would be lower than 2020 levels. Hence, governments need to target any stimulus spending on measures designed to benefit the real economy. Monetary policy alone is insufficient to rescue economies as banks are generally risk-averse; instead, central bank liquidity usually morphs into asset bubbles. Futhermore, individuals in receipt of government hand-outs tend to hoard cash instead of spending, limiting the velocity of money and impact on the real economy.
Infrastructure spending has been touted as one effective outlet for government largesse in many economies. However, infrastructure investments tend to require long gestation periods with benefits only accruing over the long term. Also, infrastructure projects require extensive planning and feasibility studies to ensure they are ‘shovel-ready’. Despite the limited short-term impact, such longer-term capital investments are necessary to enhance economic competitiveness, ease of doing business and steady job creation.
Rates steady but inflation signs ahead
In the wake of the Covid-19 crisis central banks have supplied significant monetary policy support in the form of rate cuts, balance sheet expansion, large scale asset purchases and ensuring at least some benefits of easy money pass to the real economy.
Figure 6. Central bank rate cuts over the last 12 months
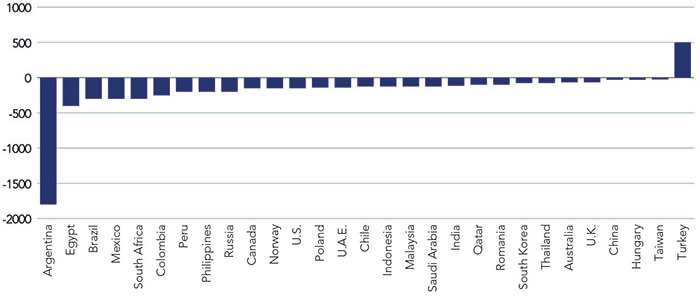
Source: Bloomberg, as at 31 December 2020.
Undoubtedly, the central bank actions have helped but rising inflationary pressure is a risk for the global economy if monetary easing is left unchecked.
Figure 7. US 30-year breakeven inflation rate
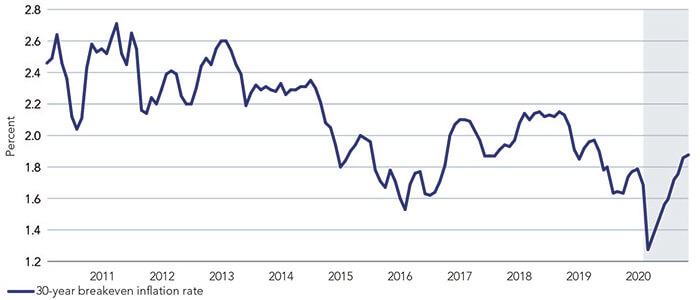
Source: Federal Reserve Bank of St. Louis, as at December 2020.
Although the Federal Reserve (Fed) has signaled that it will tolerate inflation at a higher rate to ensure economic stability, the availability of vaccines and fiscal stimulus could narrow the slack in the economy sooner than anticipated.
Several beaten-down sectors such as travel and hospitality could witness consolidation and reduced supply adding inflationary pressures to the mix: the base for comparison will be lower from April 2021 onwards as consumption was depressed in 2020.
Similarly, commodities hit a multi-year low in 2020 due to reduced demand and virus-related disruption. The supply of several commodities is unlikely to catch up with demand due to years of limited investment amid falling prices, setting the scene for potential price inflation. Emerging markets, in particular, are vulnerable to rising inflation with tight monetary policy possibly needed to contain the risks: while this is not an immediate concern it is one to watch for late 2021 and early next year.
Emerging markets: reform is the real vaccine
According to the World Bank, countries affected by major epidemics such as SARS, MERS, Ebola, and Zika have seen a 6% decline in labour productivity and falls in investment of 11% five years after the event as lingering risk aversion dampened activity.
Covid-19 will likely have a more considerable impact on productivity due to its global spread, making structural reforms vital for emerging markets to improve long term growth prospects.
Figure 8. Productivity and epidemics
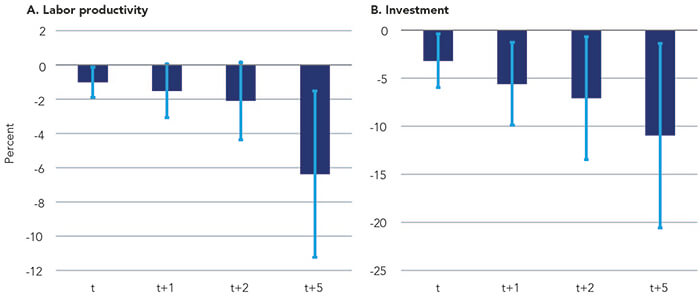
Source: World Bank, as at December 2020. Note: Bars show the estimated impacts of SARS (2002-2003), MERS (2012), Ebola (2014-2015), and Zika (2015-2016). Blue lines display the range of the estimates with 90 percentile significance. Swine flu (2009-2010), which coincided with the 2008-2009 global financial crisis, is excluded to limit possible confounding effects. The sample includes 116 economies: 30 advanced economies and 86 EMDEs.
Structural reforms also catalyse the supply-side improvements necessary to mitigate inflationary pressures. Reforms are essential as several emerging economies have vulnerabilities such as:
- low import cover (Turkey);
- high current account deficits (South Africa, Indonesia, and India);
- high inflation (India and Turkey); and,
- a high proportion of short-term foreign debt to forex reserves (Malaysia, South Africa, Turkey, and Chile).
Additionally, credit risk is high after rising state-owned enterprise (SOE) bond defaults in China while social uncertainty could become an issue around the Russian parliamentary elections in 2021.
Table 1. Emerging market vulnerability
FX reserves USD billion | Import Cover in months | Current Account (% of GDP) | Inflation (CPI YoY%) | Short Term Foreign Debt USD (Billion) | Short Term Foreign Debt as % of GDP | Short Term Foreign Debt as % of FX Reserves | |
|---|---|---|---|---|---|---|---|
ASIA (average) |
643
|
16.1
|
2.7
|
1.3
|
243
|
12
|
38.1
|
China | 3,143 | 24.2 | 1.2 | 2.6 | 1295.6 | 9.0 | 41.2 |
China A.Shares | |||||||
South Korea | 408 | 10.5 | 3.4 | 0.5 | 144.1 | 9.0 | 35.3 |
Taiwan | 513 | 23.8 | 11.8 | -0.2 | 179.9 | 27.8 | 35.0 |
India | 524 | 19.3 | -1.4 | 4.8 | 102.2 | 3.6 | 19.5 |
Indonesia | 126 | 11.9 | -2.7 | 2 | 47.2 | 4.2 | 37.4 |
Malaysia | 100 | 7.0 | 3.4 | -1.1 | 101.4 | 27.8 | 101.0 |
Thailand | 242 | 16.9 | 6.8 | -0.9 | 61.9 | 11.4 | 25.6 |
Philippines | 90 | 15.4 | -1.3 | 2.4 | 9.0 | 2.4 | 10.0 |
LATAM (average) |
192
|
14.0
|
-2.1
|
3.2
|
51.1
|
5.1
|
33.9
|
Brazil | 344 | 25.9 | -2.73 | 3.2 | 82.9 | 4.5 | 24.1 |
Mexico | 195 | 6.8 | -0.5 | 3.48 | 51.1 | 4.0 | 26.1 |
Chile | 38 | 9.2 | -3.1 | 3 | 19.4 | 6.9 | 51.5 |
EMEA (average) |
157
|
11.1
|
0.4
|
5.5
|
68.2
|
9.5
|
113.3
|
South Africa | 43 | 8.3 | -3.5 | 3.3 | 30.3 | 8.6 | 70.3 |
Poland | 108 | 6.4 | -0.1 | 3.4 | 50.2 | 8.4 | 46.4 |
Turkey | 41 | 2.5 | 0.2 | 12 | 132.8 | 17.4 | 323.0 |
Russia | 437 | 27.3 | 4.8 | 3.3 | 59.5 | 3.5 | 13.6 |
Source: Bloomberg, as at December 2020.
Strong earnings acceleration justifies EM growth prices; value not cheap but holds upside potential
EM value and growth sectors are respectively trading at more than 1.5-times and 3.5-times standard deviations away from the long term average.
Figure 9. EM value forward P/E
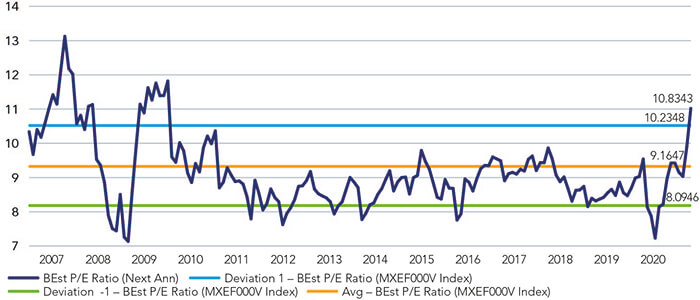
Source: Bloomberg, as at December 2020.
Figure 10. EM growth forward P/E
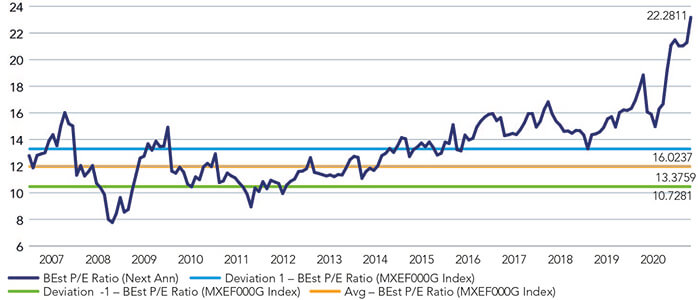
Source: Bloomberg, as at December 2020.
Growth stocks have sustained high valuations on the back of ongoing earnings results while the still relatively strong value sector performance reflects a rebound in economic activity and earnings estimates. Earnings of EM growth shares are likely to outperform developed markets while trading at broadly similar multiples.
Figure 11. Earnings per share (EPS) growth estimates (%)
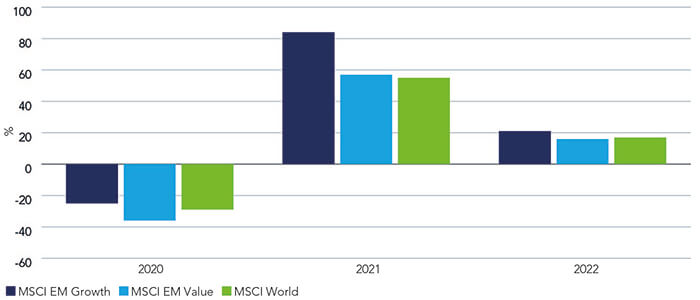
Source: Bloomberg, as at December 2020.
Since 2008 when EM value multiples have fallen from par to trading at approximately half that of the growth sector compared to the long-term average of 0.7-times.
According to analysts’ estimates, value sector earnings should rebound by about 50% in 2021 before moderating to 16% in 2022. Meanwhile, earnings for the growth sector, resilient in 2020 compared to value, are expected to increase substantially in 2021 and over 20% in 2022.
Interestingly, the projected earnings-per-share (EPS) differential of value compared to growth sectors is 0.7-times for 2021/22 (a valuation differential of 0.5-times), implying the potential for value to re-rate on a relative basis driven by the ongoing economic recovery and possible rising inflation.
Figure 12. Emerging markets value v growth valuation differential
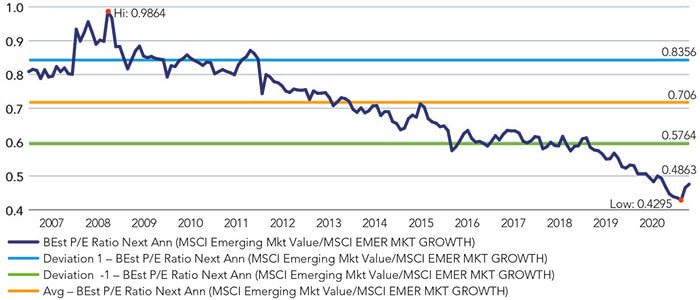
Source: Bloomberg, as at December 2020.
Investment conclusion: structural opportunities coupled with value benefiting from long-term catalysts
Fiscal and monetary stimulus programmes across the world buoyed global markets in 2020 with encouraging Covid-19 vaccine trial results providing an end-of-year boost for investors.
Notwithstanding any fallout from the new UK variant of the virus, hopes of further fiscal stimulus and a roll-out of vaccines’ are likely to keep the markets excited in the near term.
In the medium term, although global economies have been improving recently, the outlook remains mixed. Significant risks remain including the potential for fiscal stimulus to disappoint or inflation overshooting expectations. Against the uncertain backdrop emerging markets need to pursue structural reforms to ensure sustainable growth.
On the Global Emerging Marekts team, we prefer structural drivers over chasing cyclical momentum. Alongside retaining a bias towards growth and quality, we believe that there is potential in select value sectors exposed to structural drivers such as financials (demand for credit, insurance), materials (low-carbon economy). However, we still believe that a number of megatrends – as listed below – constitute the most attractive investment opportunities.
5G, digitization, cloud, IoT, electrification, automation, rising financial penetration, a growing, and aspiring middle class driving consumption, and focus on reforms/infrastructure
By targeting structural trends investors can minimise the risks associated with a delay in either vaccine roll-out rates or their efficiencies, ineffective stimulus support and rising inflation expectations. At the same time, climate change poses an existential challenge to large parts of the world. An aging society with an inevitable shift to a lower-carbon economy indicates a slower, less resource-intensive world lies ahead of us.
Country allocation review
Valuations across most emerging markets reflect prospects of strong earnings growth. But there are a few exceptions to the positive mood, notably South Africa, Turkey, and Mexico, where valuations remain cheap relative to their respective histories and compared to the rest of EM Markets.
Regardless, in South Africa and Turkey the allure of a cheap valuation is tempered by macro vulnerabilities in those jurisdictions. Valuations looks fair in China, Indonesia, Chile, and Russia compared to earnings growth. Markets in Thailand, Taiwan, and Korea look relatively expensive but remain in line with the historical relationship to EM (in terms of standard deviation away from the long-term average). India is an outlier at over 2.9-times standard deviations above its long-term average, supported by an expectation of strong earnings bounce-backs. India, Mexico and Brazil offer the strongest earnings rebounds as last year earnings collapsed 60-70%, forming a low base in 2020.
Figure 13. EM valuation (standard devation) v EPS compound annual growth rate
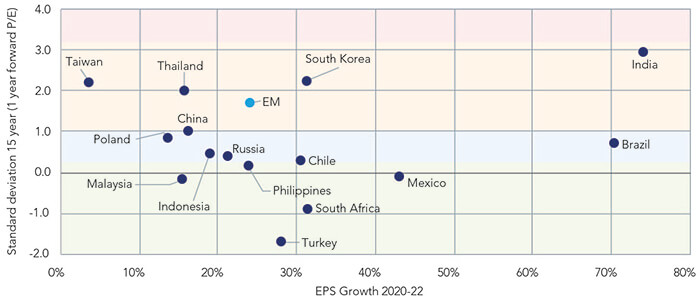
Source: Bloomberg, as at December 2020.
Neutral
China managed the Covid-19 shock well and outgrew the rest of the world in 2020 with a 2% GDP growth against a 4% decline for the rest of the world. Economists expect the Chinese economy to grow 8% in 2021 compared to 5% for everywhere else.
Despite Trump’s rhetoric and actions against China the country has managed to retain its global export share. But many high-profile Chinese SOE bond defaults have highlighted a growing credit risk amid the broader positive economic news.
Further complicating the issue, Chinese political leaders launched a sudden and unexpected move against large internet companies with new regulations and investigations. While controlling monopolistic behaviour is necessary for the healthy development of the economy, a collaborative approach to developing rules in up-and-coming industries would be a better approach without constraining innovation.
The Chinese government needs to work closely with industry to develop a strong technology backbone to counter the growing resentment against the country externally and to mitigate the negative economic impact from an eventual decoupling from global tech supply chains.
Overweight
The Korean economy quickly recovered after a brief slump last year to 2019 levels and will likely grow by 3.2% in 2021. Exports are a crucial driver for the Korean economy and are dependent on global trade flows.
Korean exports will benefit as the global economy recovers in 2021. In addition to cyclical sectors, Korea benefits from strong capability in areas that benefit from secular trends such as memory, semiconductors, EVs, battery technology, and bio-health products: there are success stories from Korea in these areas that are likely to compound value longer term.
Despite the adverse effects of Covid-19, Korean companies stepped up investments in the new economy and digitisation. Government support towards these initiatives has been meaningful at about 8% of GDP spread over the next five years. Economists expect the Korean economy to register a deficit of roughly 4% over the next few years against a surplus of 1-2% before the coronavirus crisis. However, Korea’s debt-to-GDP ratio is below 50% and one of the lowest in the region.
Neutral
The Taiwanese economy is perhaps the most resilient to macro shocks due to its unique position in the global technology and semiconductor supply chain, giving the country exposure to secular drivers such as 5G, IoT, automation, electrification, and cloud computing.
Artificial Intelligence (AI) is likely to be the future of technology and will drive demand for semiconductors and hardware benefiting Taiwan over the medium- to long-term. A few commentators are equating the geostrategic importance of Taiwan’s semi-conductor strength with the Middle East dominance of the oil market. This unique position also brings risks, especially China’s long-term ambition of unifying Taiwan with the mainland.
Overweight
The Indian economy is likely to shrink 8.5% over the 12 months to the end of March 2021 – an outcome better than the 10% decline previously estimated by economists.
Even so, the GDP decline represents a significant slowdown considering the economy had been growing at 6-7% per year previously. Some economists estimate that the economy will grow 9.2% in the following fiscal year driven by a double-digit rebound in industrial production and investments.
A worsening banking sector and a painful transition from bold structural reforms hit the economy hard over the last few years. The economy was displaying some signs of a nascent recovery, including stabilisation in the banking and non-banking financial sectors when the pandemic damaged the recovery. The government responded by announcing further structural reforms in agriculture, manufacturing, and labour laws, intensifying a focus on the long term and enhancing the country’s competitiveness.
India has a high fiscal deficit and consumer price inflation, limiting the possibility of any immediate stimulus necessary to boost growth in the near term. As supply-side disruption slows, economists expect the CPI to narrow the gap with an already moderate wholesale price inflation, thereby offering the Reserve Bank of India room to cut rates.
The government provided financial support to the economy by announcing a targeted production-linked incentive program boosting domestic manufacturing capability. This approach is likely to be productive as it prioritises investment and capital formation over a one-time consumption boost from cash handouts.
Overweight
To date, the Indonesian economy has not materially recovered from the pandemic. While consumer confidence has improved it remains below pre-Covid levels.
Nevertheless, economists expect the Indonesian economy to shrink only 2% in 2020 and grow about 5% in 2021 in line with its historical growth-rate. Inflation has remained under control allowing the central bank to cut rates.
However, inflationary pressures could return in 2021 if the central bank funding of the fiscal deficit continues. Maintaining fiscal credibility is vital for emerging markets. Indonesia will have to ensure that consumer confidence returns while managing rising inflation and budgetary risks. The government has rightfully focused on the ease of doing business reform with the Omnibus Law that is likely to boost foreign direct investment (FDI). Attracting FDI flow is crucial as fiscal deficit is 2-3% higher than history, limiting the government’s ability to invest in the economy.
Underweight
While Thailand does not have emerging market issues such as inflation or twin deficits its economy policy lacks strong vision. FDI hit a peak in 2013 and has been lacklustre despite efforts to promote the Eastern Economic Corridor.
The Thai economy is dependent on tourist inflows and petroleum exports, which have both been disrupted by Covid-19 with only a slow return to normality expected. Thailand needs stable growth drivers led by consumption and private investments in sectors outside the property sector.
However, consumer confidence is at a multi-decade low, and capacity utilisation has been stuck in the 65-70% range for several years, limiting investments. While there will be some opportunity to catch up as the economy normalises, the valuation (forward P/E) at over 2-times standard deviations away from the long-term average is not cheap.
Neutral
Although Russia is dependent on oil, the economy operates under a robust macroeconomic policy framework that includes a prudent fiscal policy, inflation-targeting, and a flexible exchange rate. Under this policy, Russia has accumulated forex reserves up to 25% of GDP.
Despite prudent macro-governance the economy is likely to grow 2-3% annually, which is inadequate to boost living standards (per capita income) materially. Hence, Russia needs to focus on reforms, especially those that result in infrastructure creation and improve the standard of living for the masses.
Implementation of Putin’s national projects has been far from satisfactory while the country faces a growing risk of sanctions following the exit of Trump from the White House. Russia will benefit in the near term from stabilisation in the energy markets. Although the economy has adjusted to lower oil prices, exposure to conventional energy is also a risk from a medium- to long-term perspective. The world is moving to a low-carbon and renewable energy future, suggesting the Russian economy must diversify.
Neutral
The Turkish macro-economy is vulnerable to external shocks after the country depleted all its forex reserves defending the currency. Compounding its domestic woes, the government in Turkey faces the threat of US sanctions over the S-400 missile and Turkish interference in both the Mediterranean and the Middle East.
Turkey is suffering from stagflation due to years of economic mismanagement. Controlling inflation is crucial as it is above 10% and compels the locals to buy foreign currency as a hedge against high inflation and a weak lira. A weak lira exacerbates inflation in Turkey given its negative current account.
The Turkish lira has been one of the worst-performing currencies losing about 20% in 2020. However, the recent appointments of Naci Agbal as the central bank governor and Lutfi Elvan as finance minister have been viewed as positive developments by investors. Furthermore, the recent 6.75% rate hike suggests that the central bank has learned prudence. But a policy u-turn by Turkish president Recep Erdogan is a risk. Nevertheless, as one of the cheapest EM markets, Turkey could represent a compelling investment case if the conservative macro-approach persists.
Underweight
South Africa’s economy is stagnant with numerous structural issues such as a large fiscal deficit, debt burden, unemployment, inequality, and above all, a lack of strong political will to resolve them.
The rand appreciated after hitting an all-time low in April and is roughly 5% lower against the US dollar in 2020 driven by flows looking for a better (positive) yield. While the economy is likely to benefit from a weak dollar and rising demand for commodities this will not be a panacea for all the structural issues. Bold reforms are needed to ensure that the economy embarks on a sustainable growth journey to bring millions out of poverty. President Ramaphosa’s economic reconstruction and recovery plan is meant to boost the economy via infrastructure development, re-industrialisation, and job creation. The project sounds promising, however, implementation is lacking partly due to the political opposition, vested interests, anti-corruption drives, and SOE involvement with governance issues in the program.
Understandably, the market is one of the cheapest in EM but there is upside potential if the reform and infrastructure projects accelerate in 2021.
Underweight
Economists expect Brazil’s economy to shrink 4.5% in 2020 before bouncing back 3.5% this year. Brazil should benefit from a near-term bounce as the economy is mostly cyclical, boosted by a weak dollar and rising demand for commodities.
However, growth is estimated to moderate to 2.5% in 2022 with unemployment in double-digits and limited progress on the fiscal front, absent any pro-business reform. Unemployment, deficit, and debt are significant issues for Brazil that need urgent reform. While the Brazilian government is pro-business and pro-reform, a large pipeline of reforms await implementation. Equities are not cheap and already reflect the robust earnings growth estimates for 2021/22, coming off a very low base in 2020.
Overweight
The Mexican economy is expected to shrink 9% in 2020 ahead of a forecast return to 3.5% growth this year.
While the decline is steep and the recovery modest, the Mexican economy is not especially vulnerable. On the contrary, the economy is a competitive place for manufacturing, benefits from infrastructure spend in the US and has a well-regarded central bank.
Mexican household leverage and unemployment levels remain low. Formal employment could rise with the implementation of the US-Mexico-Canada Agreement (USMCA).
However, the economic environment in Mexico is not entirely benign. For instance, a recent bill was tabled forcing the central bank to buy dollars from Mexican banks despite concerns the move will expose the bank to money-laundering with the potential to disrupt its relationship with the US Federal Reserve and other central banks. According to Mexican debt rating company HR Ratings, the law’s passage could trigger an increase in risk perception, possibly resulting in higher long-term interest rates, capital outflows, and a depreciation of the peso. The central bank’s room to further lower interest rates will be limited in such a scenario.
Low business confidence and spare capacity in the system is resulting in limited private sector investment. Nonetheless, Mexico’s fiscal position remains reasonable despite the woes of its major oil company, Pemex. As the oil price recovers concerns around the sustainability of Pemex’s debt position should reduce. Mexico’s valuation is cheap compared to the rest of EM despite strong earnings growth prospects.
Share:
Risk profile
- This document does not constitute a solicitation or offer to any person to buy or sell any related securities or financial instruments.
- The value of investments and income from them may go down as well as up, and you may not get back the original amount invested.
- Past performance is not a reliable indicator of future results and targets are not guaranteed.
- Investments in emerging markets tend to be more volatile than those in mature markets and the value of an investment can move sharply down or up.