

Virus valuations
Small-cap companies have been trampled in the recent sell-off, as investors focused on liquidity and rushed to exit the market. The Russell 2500 index has fallen by about 25% since the start of the year, compared to the S&P 500 which has declined by about 10% (see figure 1).
Figure 1. S&P 500 and Russell 2500
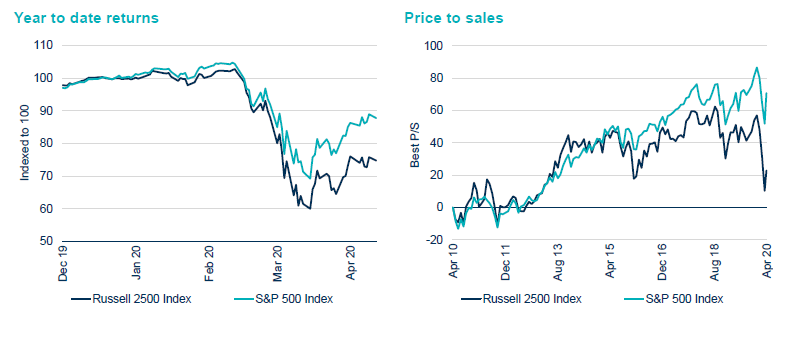
Source: Bloomberg, as at April 2020.
There is some justified scepticism about the accuracy of near-term earnings estimates. Nonetheless, the Russell 2500 index is now trading at 14x forward earnings, compared to a typical level of about 17x and more than two standard deviations below its long-term average. By contrast, the S&P 500 has moved back in line with its long-term average.
Earnings-per-share (EPS) growth for the Russell 2500 index has been about 10% a year over the last decade. Assuming that the index is about to regain its long-term forward price/earnings (P/E) multiple – and there are reasons you could argue that lower interest rates justify a higher multiple – this suggests that now is an attractive entry point for investors with longer-term horizon. Moreover, our portfolio names offer upside potential of 52%, compared to a typical range of 15%-25%.
Overstretched: growth outperforms value
Growth has continued to outperform value during the sell-off (see figure 2). US SMID is a core Strategy that includes both growth and value stocks, which means this is a potential headwind for us – particularly as we have a valuation discipline that we stick to. This makes buying high growth (or very long duration) businesses – and holding on to them – trickier. As rates have been cut from about 3% to zero, growth assets have received further support. Because discounting occurs at a lower rate, cashflows that happen later are now worth more today.
Figure 2. Russell 2500 growth and value indices

Source: Bloomberg, as at April 2020.
The situation is akin to a stretched piece of elastic. We believe that growth stocks are likely to snap back, which would be helpful for a core, valuation-sensitive strategy like ours.
Growth ‘momentum’ is vulnerable when there is both extreme outperformance of that factor and elevated optimism about its future returns. Both conditions are currently present, as the mantra that growth companies are the only way to invest has become consensus. We think that allocating to a broader spread of assets is more likely to generate outperformance over the coming years.
Record amounts of stimulus, the infrastructure package that is on the way and the reopening of the economy means the long end of the yield curve could face inflationary pressures. Value stocks tend to outperform from the bottom of a bear market and in a rising interest-rate environment, as do smaller companies.
An indiscriminate sell-off
The team’s collective experience of three downturns suggests that the fundamental strength of any portfolio tends to reassert itself in time. During the first phase of a market shock, investors sell what they can to raise cash and the Strategy typically performs in line with the market. The second phase is when central banks have historically stepped up. Phase three is when the market settles down and it becomes apparent that good-quality businesses have the potential to outperform as the market rerates businesses with stronger fundamentals.
The Q4 2018 sell-off is a good illustration of this. Our Strategy performed moderately in phase one, selling off a little less than the market. It then underperformed in Q1 2019, which we can roughly equate to the second phase of the cycle – a period when the market roared back thanks to support from the Federal Reserve. During the second and third quarters, quality began to rise to the top again and the Strategy recorded significant outperformance (see figure 3).
Figure 3. Relative return between the US SMID Strategy and Russell 2500
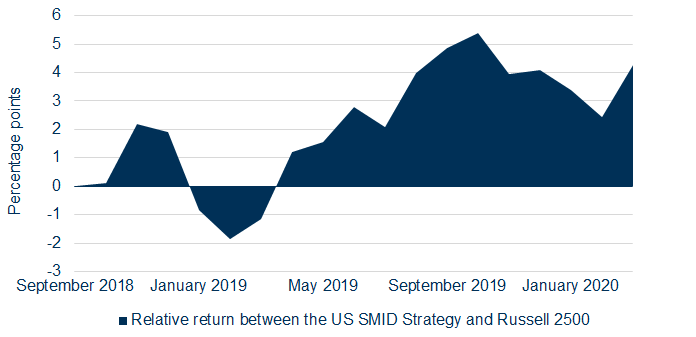
Source: Bloomberg, Federated Hermes, as at April 2020. All data gross of fees in US dollars, relative calculated arithmetically.
Figure 4. US SMID Strategy rolling performance
31/03/19-31/03/20 | 31/03/18-31/03/19 | 31/03/17-31/03/18 | 31/03/16-31/03/17 | 31/03/15-31/03/16 | |
|---|---|---|---|---|---|
US SMID Strategy | -18.53 | 3.19 | 7.94 | 16.30 | 1.42 |
Source: Federated Hermes as at 31 March 2020. Performance shown is in USD, net of fees. The information presented is supplemental to the GIPS® compliant information that follows.
Looking ahead
Since the sell-off started, we have exited four positions from a portfolio of 60 names. This is because we could not convince ourselves that future cashflows from these businesses would support existing debt. We have also made selective acquisitions of high-quality businesses at attractive prices, which we believe have the potential to deliver good performance over the medium term.
Assuming anything other than an apocalyptic progression of the coronavirus pandemic, we believe the portfolio is set up for strong future returns from here. In particular, we are excited about the portfolio’s current combination of quality and value.
Hermes US Small & Mid Cap
GIPS® Composite
Composite: Hermes US Equity Small & Mid Cap Active
Creation date: 07 December 2006
Inception date: 01 November 1987
All information is quoted in USD
Year | Gross of Fees Return | Net of Fees Return | Benchmark Return | Composite 3-Yr St Dev (%) | Benchmark 3-Yr St Dev (%) | No of Portfolios | Composite Dispersion | USD Total Composite Assets (Milion) | % Total Firm Assets |
|---|---|---|---|---|---|---|---|---|---|
2018 | -8.8 | -9.4 | -10.0 | 13.4 | 14.1 | <5 | – | 1373 | 4.3 |
2017 | 12.2 | 11.4 | 16.8 | 11.4 | 12.1 | <5 | – | 1551 | 4.5 |
2016 | 21.3 | 20.4 | 17.6 | 12.7 | 13.7 | <5 | – | 1492 | 5.2 |
2015 | 2.2 | 1.4 | -2.9 | 12.3 | 12.4 | <5 | – | 1406 | 5.0 |
2014 | 6.1 | 5.3 | 7.1 | 10.6 | 11.7 | <5 | – | 1175 | 3.0 |
2013 | 36.8 | 35.8 | 36.8 | 14.7 | 15.6 | <5 | – | 1819 | 4.6 |
2012 | 22.7 | 21.8 | 17.9 | 18.0 | 19.0 | <5 | – | 923 | 2.7 |
2011 | 2.3 | 1.6 | -2.5 | 23.3 | 23.4 | <5 | – | 652 | 1.9 |
2010 | 23.6 | 22.8 | 26.7 | – | – | <5 | – | 644 | 1.7 |
2009 | 36.2 | 35.2 | 34.4 | – | – | <5 | – | 528 | 1.5 |
Hermes Fund Managers Limited claims compliance with the Global Investment Performance Standards (GIPS®) and has prepared and presented this report in compliance with the GIPS® standards. Hermes Fund Managers Limited has been independently verified for the periods 1 January 1998 through 31 December 2018. The verification report is available upon request. Verification assesses whether (1) the firm has complied with all the composite construction requirements of the GIPS® standards on a firm-wide basis and (2) the firm’s policies and procedures are designed to calculate and present performance in compliance with the GIPS® standards. Verification does not ensure the accuracy of any specific composite presentation.
For the purposes of compliance with GIPS®, the firm is defined as Hermes Fund Managers Limited (“Hermes”), an asset management group consisting of a number of subsidiary or affiliate companies. As of 31 December 2009 the Hermes Fund Managers Limited firm definition was broadened to better represent the full range of investment strategies offered. Hermes Investment Management is the brand name for the Hermes group including Hermes Fund Managers Limited. Information about changes is available upon request. Gross of fees returns have been calculated gross of management, custodial fees and reclaimable withholding taxes, but after all trading commissions.
The composite includes all discretionary portfolios following the Active US Small & Mid Cap strategy run by the Hermes US Small & Mid Cap team and has an inception date of 1 November 1987. The objective of the strategy is to exceed the return on the benchmark on a three year moving average basis. The composite’s benchmark is the Russell 2500 Index, which is designed to measure the equity market performance of the small to mid-cap segment of the U.S. equity universe, commonly referred to as “SMID” cap. The Russell 2500 Index is a subset of the Russell 3000 Index. It includes approximately 2500 of the smallest securities based on a combination of their market cap and current index membership. The benchmark is market-cap weighted. Performance returns shown in USD. The composite base currency is USD.
Since inception the management fee schedule for this strategy was 0.90% per annum for the first USD 25mln, 0.80% per annum for the next USD 25mln and 0.70% per annum thereafter. As of 1 January 2014 the management fee schedule for this strategy is 0.75 % per annum.
The standard fees are shown in Part 2A of its Form ADV. For historical fees, please contact Hermes. Net results reflect the above-mentioned fee schedules, actual results may vary for each individual portfolio.
Composite descriptions, along with additional information regarding policies for valuing portfolios, calculating performance, and preparing compliant presentations are available upon request. Where appropriate, composite dispersion is calculated as the asset weighted standard deviation of the annual returns of the constituent portfolios. If a composite consists of less than five portfolios for the full year then no measure of dispersion is shown. The three year annualised standard deviation measures the variability of the composite and benchmark returns over the preceding 36 month period. Standard deviation measures are not shown where there are less than 36 monthly observations available. Standard deviation measures are not required for periods prior to 2011.