

Fast reading:
- EU consumer price inflation figures for February surpassed expectations, with both headline and core inflation coming in higher than anticipated.
- The ECB is likely to retain a pronounced tightening bias, as price pressures intensify off the back of the data releases.
- The surge in economic activity has been most pronounced for the services sector, with China’s manufacturing activity surging to its highest reading in more than a decade as the country returns to normality post-Covid.
Eurozone inflation fell less than expected in February1, reinforcing expectations that the European Central Bank (ECB) will continue in its tightening monetary policy stance.
Euro area annual inflation fell to 8.5% in February2, down from 8.6% in January. While this constitutes the fourth consecutive monthly decline since October, it still represents a smaller decline than initially forecast by experts.
Core inflation, however – which excludes more volatile food and energy prices – climbed to a new Eurozone record of 5.6%3, up from 5.3% in January and well above expectations.
For Silvia Dall’Angelo, Senior Economist at Federated Hermes Limited, the recent data paints a picture of increasing underlying price pressures. “This will embolden the hawks in the ECB’s Governing Council, and with a 50bp rate hike at the March meeting now a done deal, the tone will likely remain hawkish, with the central bank retaining a pronounced tightening bias.”
Orla Garvey, Senior Fixed Income Portfolio Manager notes that the ECB terminal rate for December 2023 is projected to be 3.86%, 130 basis points higher than the current deposit rate. “With five-year, five-year forward inflation expectations in the EU almost matching those of the US at 2.52%, this suggests an unstable market equilibrium,” she says.
Building back better
Elsewhere, the global manufacturing PMI increased to 50 in February4, increasing from 49.1 in January, which moved the index into expansionary territory for the first time since August 2022.
Dall’Angelo, notes this may hint at a synchronised recovery across regions. “The recent reopening of the Chinese economy likely played a role, although China’s PMI survey showed gains were more pronounced in the services sector, which is more reflective of domestic demand dynamics.”
Indeed, manufacturing activity surged to its highest reading in more than a decade as the sector began to return to normal after years of pandemic-related disruption and following Beijing’s decision to abandon strict lockdown measures. The PMI stood at 52.6 last month5, according to the National Bureau of Statistics (NBS), surpassing expectations and reaching its highest level since 2012.
With inflation expectations in the EU almost matching those of the US, this suggests an unstable market equilibrium
One coffee to go, please
The Pret A Manger Ltd (Pret) Index6, which tracks consumer transactions against a pre-pandemic benchmark across key financial districts and regional cities, towns, and stations, was created by Bloomberg as a way of recording economic recovery in the aftermath of the Covid-19-pandemic. The food chain is popular among city workers in particular, and is therefore considered an accurate marker of economic activity.
As demonstrated by the graph below, for the England and Scotland dataset only, the index saw a sharp dip in consumer activity during the festive periods for 2022 and 2023, respectively, at a time where many office workers are not populating city districts. More broadly, however, the data illustrates a post-pandemic reset as city centres come back to life.
Figure 1: The Pret Index tracks the economy’s return to post-Covid normality
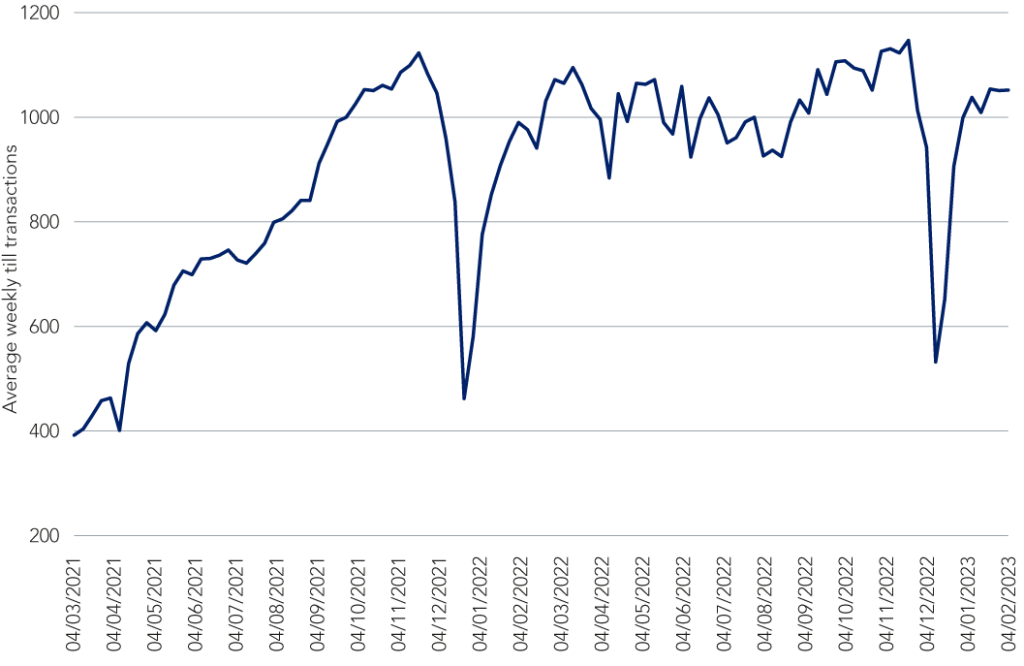
Source: The Office for National Statistics, as at 2 March 2023. Note: Data only includes in store transactions, and does not include online or delivery sales.
To find out more about our outlook for China, please watch our latest video insight.
1 The Financial Times, as at 2 March 2023.
2 Eurostat, Flash Estimate, as at 2 March 2023.
3 Eurostat, Flash Estimate, February 2023, as at 2 March 2023.
4 The Financial Times, as at 1 March 2023.
5 China’s purchasing manager’s index, as at 1 March 2023.
6 This dataset contains transactional data from approximately 400 stores around the UK. This data is presented as an index of the average weekly till transactions in the first four weeks of 2020 (between Friday 3 January and Thursday 30 January 2020). Due to this method of data presentation, users should expect an element of seasonality in the data.