

As the Hermes Global High Yield, Global Investment Grade, Multi-Strategy and Absolute Return Credit strategies hit key milestones, Fraser Lundie CFA, Co-Head of Credit at Hermes Investment Management, explains how a rigorous investment process has allowed them to weather volatile storms.
Marking new milestones
This month, our Global High Yield Credit, Multi-Strategy Credit and Absolute Return Credit capabilities mark their eight-, five- and three-year anniversaries, respectively and in July, our Global Investment Grade Strategy will celebrate its eight-year anniversary. These four strategies have the following aims:
- Global High Yield Credit: generate a high level of income by investing primarily in a diversified portfolio of high-yield bonds. Since its May 2010 inception, it has consistently delivered top-quartile return1.
- Global Investment Grade: generate consistent, positive returns with low volatility by investing globally in investment-grade credit instruments.
- Multi-Strategy Credit: capture the majority of the high-yield market’s upside while minimising downside risk.
- Absolute Return Credit: consistently generate positive returns irrespective of the market direction, across asset classes and geographies with an investment-grade risk profile.
Note: Targets cannot be guaranteed.
Since the launch of these strategies, we have invested through tumultuous economic episodes and periods of geopolitical uncertainty while delivering on mandates:
In the first half of 2018, credit investors faced a period of heightened geopolitical risk, including the US-China trade dispute, North Korean nuclear tensions, and the re-imposition of US nuclear sanctions on Iran. Such risks contributed to the re-emergence of volatility in February – the fourth largest spike in volatility since 19952. Thanks to our proven investment approach, we were able to navigate through this period with optimal risk management and dynamic sizing of positions as regimes changed.
For credit investors, 2017 was largely characterised by rallying markets. In this benign environment, we aimed to optimise the convexity of our credit exposure to maximise upside capture. We increased returns by taking positions further along the credit curve and by finding attractive opportunities in unloved sectors, such as US retail.
In Q3 2015, amid growing certainty that the Fed would raise rates for the first time in almost a decade, liquidity fears spurred a global high-yield sell off that drove the market -4.50% lower for the quarter. In the preceding months, we increased our investment-grade credit and leveraged-loan allocation to 30% of the portfolio, and this exposure to higher quality assets preserved capital during a period of market stress and helped drive our 1.05% return for Multi-Strategy Credit in 20153.
A proven track record
Our dynamic approach to global credit has driven strong risk-adjusted returns across our diversified range of high-conviction strategies, as evidenced by their Sharpe ratios4, despite macroeconomic and technical market shocks (see figure 2 and 3).
Figure 2: The performance of our strategies since inception
Strategy | Inception date | Three-year cumulative returns (gross, USD) | Since inception cumulative returns (gross, USD) | Since inception Sharpe Ratio |
|---|---|---|---|---|
Global High Yield | 1 June 2010 | 25% | 91% | 1.2 |
Multi-Strategy Credit | 1 June 2013 | 15% | 30% | 1.6 |
Investment Grade | 1 July 2010 | 15% | 47% | 1.3 |
Absolute Return | 1 June 2015 | 7% | 7% | 1.5 |
Source: Hermes as at 31 May 2018.5 Past performance is not a reliable guide to future performance. The value of investments and income from them may go down as well as up, and you may not get back the original amount invested.
Figure 3: Liquid credit net annualised returns
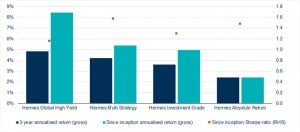
Figure 4: Rolling Performance
Strategy | 31/05/17 to 31/05/18 | 31/05/16 to 31/05/17 | 31/05/15 to 31/05/16 | 31/05/14 to 31/05/15 | 31/05/13 to 31/05/14 |
|---|---|---|---|---|---|
Global High Yield | 2.42% | 12.21% | -1.66% | 3.36% | 10.83% |
Multi-Strategy Credit | 0.98% | 8.69% | 1.12% | 2.46% | 10.56% |
Investment Grade | 1.48% | 5.61% | 2.99% | 3.59% | 4.71% |
Absolute Return Credit | 1.04% | 3.55% | 0.70% | – | – |
Source: Hermes as at 31 May 2018. All performance shown is in USD net of fees.
1 Source: Morningstar peer group as at 30 April 2018. Peer Group is the Morningstar Global High Yield Bond – EUR Hedged.
2 Bloomberg as at March 2018.
3 Performance shown is in USD gross of fees for the 12 months to 31 December 2015.
4 Note: The Sharpe ratio is a measure of excess portfolio return over the risk-free rate relative to its standard deviation.
5 The performance of Hermes Multi-Strategy Credit and Hermes Absolute Return Credit is shown in USD, gross of fees. The performance of the Hermes Global High Yield Credit and Hermes Global Investment Grade strategies is hedged to USD, gross of fees.