

World GDP: recovering, but still short of pre-pandemic projections….
Prospects for the world economy have brightened. In its latest Economic Outlook, the OECD sees global GDP growth at 5.8% this year and 4.4% in 2022 – up from its previous estimates of 5.6% and 4.0%, respectively. But for several economies, the rate of expansion this year is unlikely to recover lost output from 2020. For example, euro area GDP declined by 6.7% in 2020 and it is likely to grow by only 4.3% this year. Similarly, South Africa faces a long recovery time after GDP shrunk by 7% in 2020 and it is likely to increase by 3.8% in 2021. Conversely, in the developed world, Australian, Canadian and the US economies are accelerating this year, recovering the full economic loss triggered by the Covid-19 pandemic. Meanwhile, in the emerging world, full economic recoveries are expected in Korea, India, Indonesia, and possibly Turkey.
Figure 1. Economic outlook projections: real GDP growth
% year-on-year, colours indicate the direction of revisions since the December 2020 Economic Outlook
2020 | 2021 | 2022 | |
|---|---|---|---|
World | -3.5 | 5.8 | 4.4 |
Australia | -2.5 | 5.1 | 3.4 |
Canada | -5.4 | 6.1 | 3.8 |
Euro area | -6.7 | 4.3 | 4.4 |
Germany | -5.1 | 3.3 | 4.4 |
France | -8.2 | 5.8 | 4.0 |
Italy | -8.9 | 4.5 | 4.4 |
Spain | -10.8 | 5.9 | 6.3 |
Japan | -4.7 | 2.6 | 2.0 |
Korea | -0.9 | 3.8 | 2.8 |
United Kingdom | -9.8 | 7.2 | 5.5 |
United States | -3.5 | 6.9 | 3.6 |
2020 | 2021 | 2022 | |
|---|---|---|---|
G20 | *3.1 | 6.3 | 4.7 |
Argentina | -9.9 | 6.1 | 1.8 |
Brazil | -4.1 | 3.7 | 2.5 |
China | 2.3 | 8.5 | 5.8 |
India* | -7.7 | 9.9 | 8.2 |
Indonesia | -2.1 | 4.7 | 5.1 |
Mexico | -8.2 | 5.0 | 3.2 |
Russia | -2.6 | 3.5 | 2.8 |
Saudi Arabia | -4.1 | 2.8 | 3.8 |
South Africa | -7.0 | 3.8 | 2.5 |
Turkey | 1.8 | 5.7 | 3.4 |
Source: OECD Economic Outlook, as at 31 May 2021.
Despite the recovery, world GDP will be about US$3tn less by the end of 2022 compared to the OECD’s pre-pandemic estimates.
Figure 2. World GDP (Index 2019 Q4 = 100)
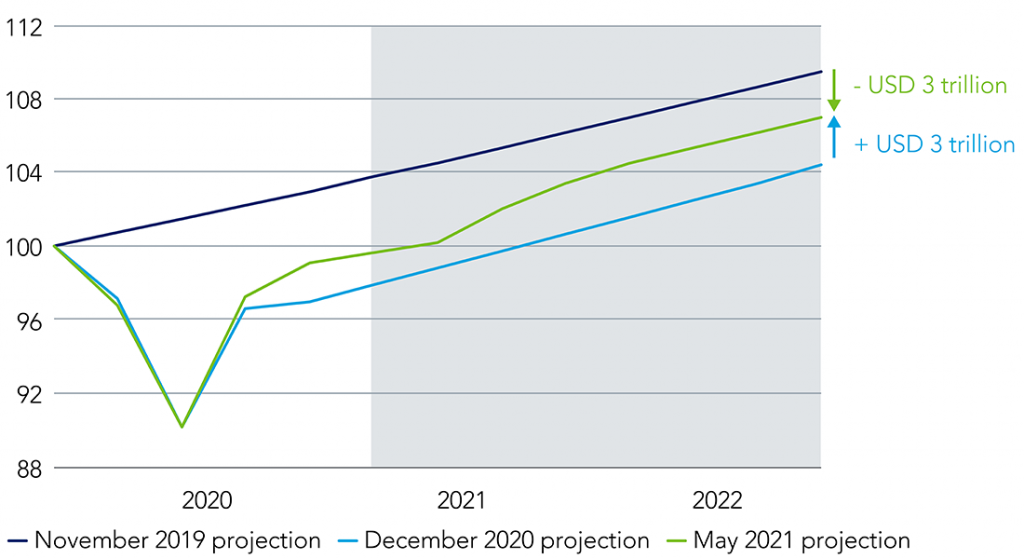
Source: OECD, as at 31 May 2021.
On a per capita GDP basis, few emerging economies are likely to recover to pre-pandemic levels before the end of this year. Moreover, the pace of economic recovery is sluggish in some cases – and there’s disparity in economic conditions – with Saudi Arabia, South Africa, and Argentina taking the longest time to recover fully.
Figure 3. How long to recover to pre-pandemic GDP per capita?
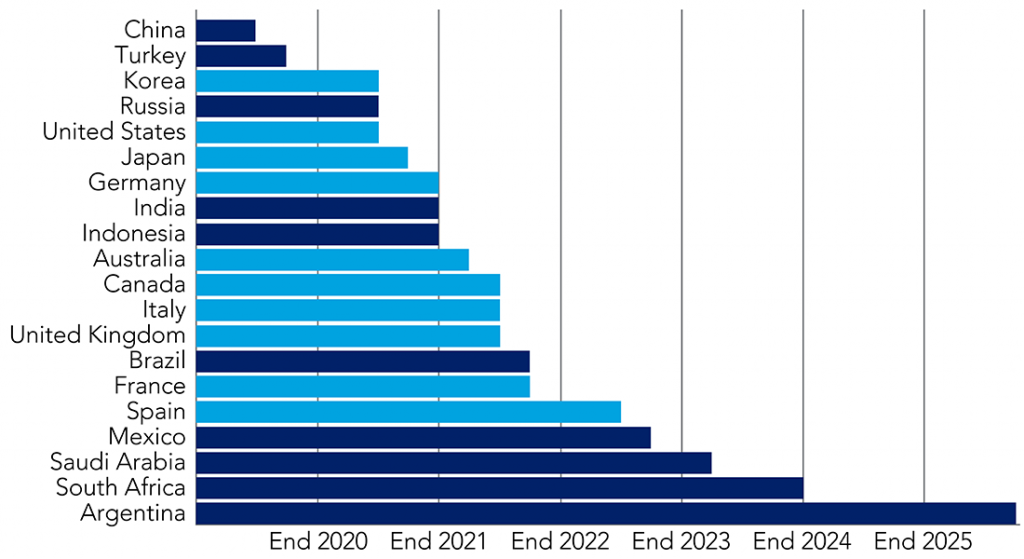
Source: OECD Economic Outlook, as at 31 May 2021.
…and there’s a high level of uncertainty in estimates
The vaccine availability is limited, and the rollout is uneven. Several developed nations have successfully vaccinated over 50% of the population (with at least one dose of the vaccine), while Asia and several less developed economies are lagging behind. The uneven pace of vaccinations and restrictions on full mobility adds uncertainty to growth estimates. According to the OECD, Asia’s growth rate will fall below 5%, Latin America will grow by only 1%, and world GDP will expand by about 3% in a downside scenario.
Figure 4. 2022 GDP growth by region
Year-on-year, %
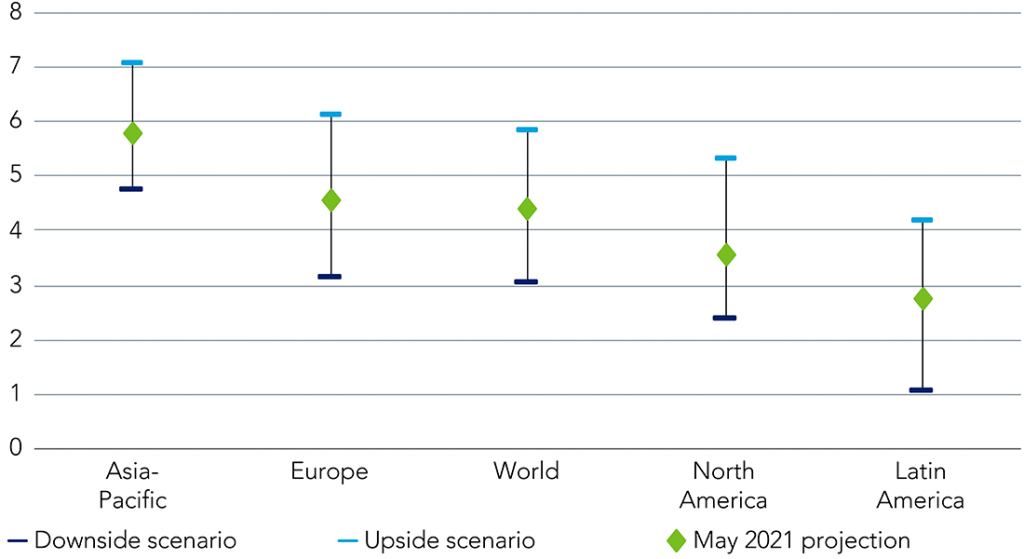
Source: OECD, as at 31 May 2021.
Global debt hits record high in 2020
The worldwide debt-to-GDP ratio reached 275% of GDP in 2020, with developed markets at 300% and emerging markets at 225%. These are elevated levels (see figure 5). As a result of record low borrowing costs and the need to stimulate economies fiscally, policymakers have borrowed more to cushion the loss of economic output. However, debt needs to stabilise, leaving limited fiscal space for future shocks.
Figure 5. Total debt to GDP (%)
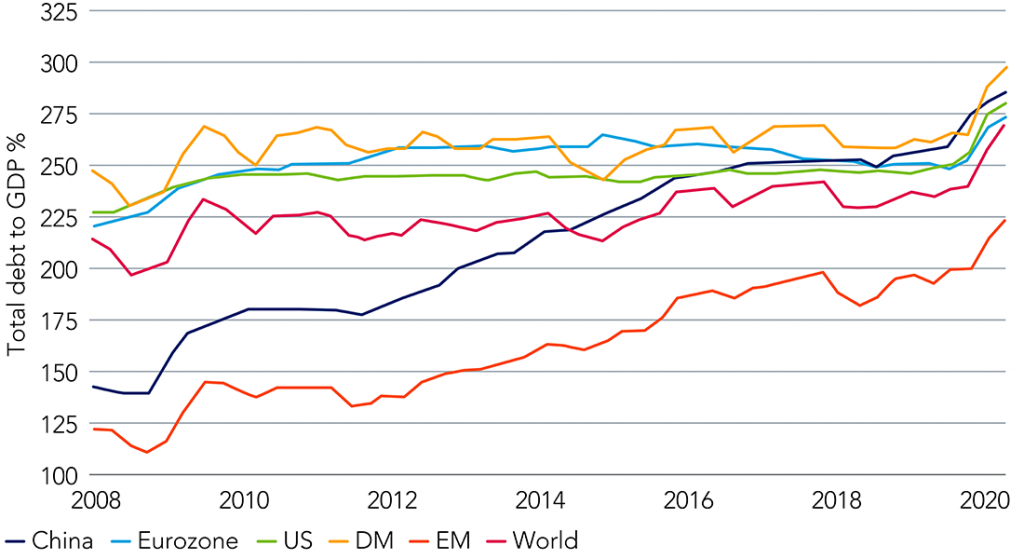
Source: BIS, HSBC, as at 1 March 2021. Total debt includes household debt, government debt and non-financial corporates debt. Excludes financial corporates debt.
Monetary policy action is likely to be less accommodative
Inflation continues to rise in most emerging markets. There are very few markets (notably, Indonesia, Colombia, and China) where inflation is subdued and below the central bank target. In most markets, inflation is either within the band or it has risen above the target level, prompting a turn in the monetary policy.
Figure 6. Consumer price inflation and inflation target range (year-on-year, %)
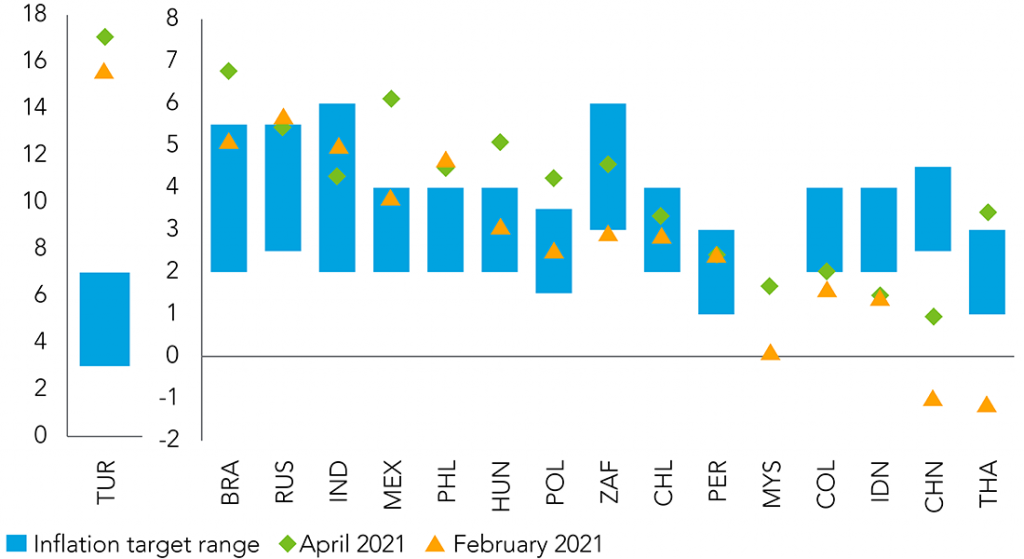
Source: IMF (EM Inflation and Monetary Policy Update), as at May 2021.
Although the inflation expectation survey does not suggest a significant risk of inflationary pressures over the medium term, most emerging markets are expected to maintain real policy rates below zero.
Figure 7. Inflationary pressures are not expected over the medium term
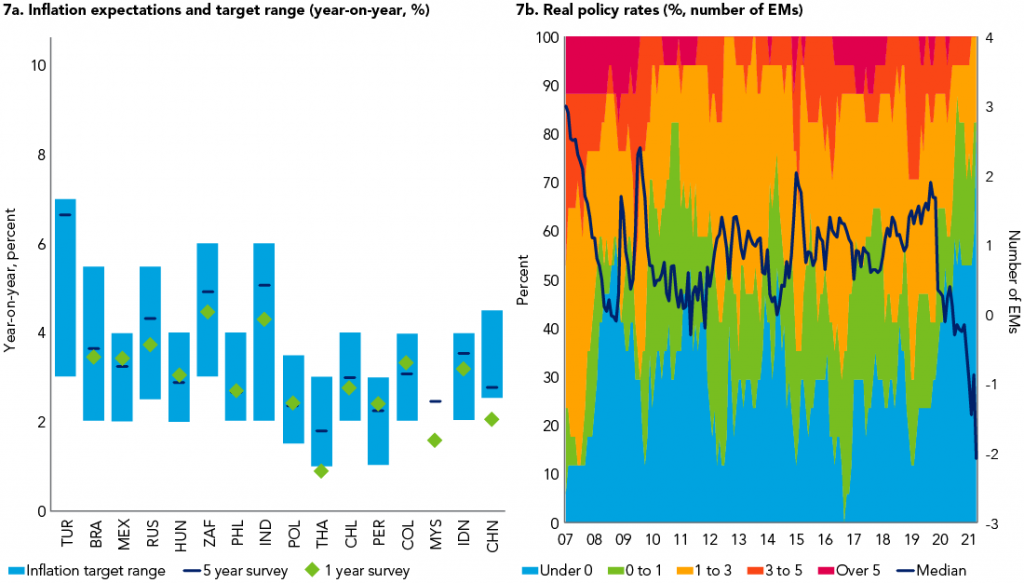
Source: IMF (EM Inflation and Monetary Policy Update), as at May 2021.
Rising near-term inflationary pressure and possible normalisation of the US monetary policy is likely to prompt central banks to tighten policy, with swap markets already expecting policy tightening in several emerging markets – primarily, Latin America over the next few years, while they’ve turned hawkish in Poland and Hungary. In addition, inflation is running ahead of the upper band in several countries where the swap market is expecting policy tightening (e.g., Brazil, Mexico).
Figure 8. Policy tightening is expected in several emerging markets
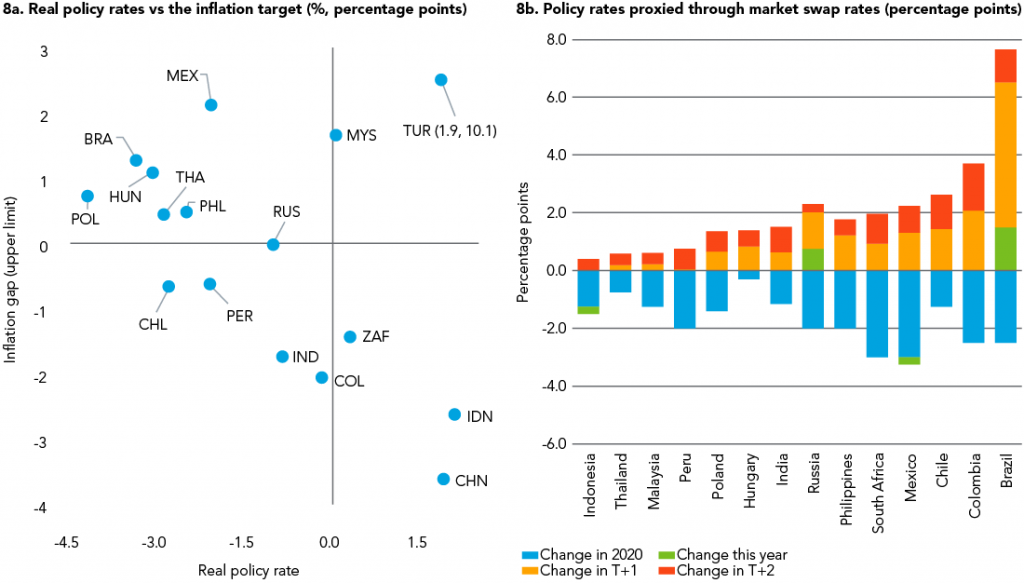
Source: IMF (EM Inflation and Monetary Policy Update), as at May 2021.
EM vulnerability assessment: rising inflation and rates are a risk
Economies in EMEA (ex-Russia) are the most vulnerable due to low import cover, high inflation, and a high proportion of short-term foreign debt. In addition, the rising US 10-year bond yield (in real terms) will have implications across emerging markets – particularly, in countries with a high dependency on foreign capital. Most EM economies have a positive spread over the US 10-year in real terms despite maintaining negative real policy rates.
Figure 9. Emerging markets vulnerability assessment
FX reserves USD billion | Import Cover in months | Current Account (% of GDP) | Inflation (CPI YoY%) | Short Term Foreign Debt USD (Billion) | Short Term Foreign Debt as % of GDP | Short Term Foreign Debt as % of FX Reserves | Real Policy Rate | Local 10 yr yield Spread vs US 10 Yr | Spread vs US 10 Yr (REAL) | |
|---|---|---|---|---|---|---|---|---|---|---|
ASIA (average) | 665 | 13.9 | 3.3 | 2.4 | 252 | 12.5 | 38.5 | -0.19 | 1.99 | 2.55 |
China | 3,170 | 16.3 | 1.5 | 1.5 | 1316 | 9.2 | 41.5 | 2.9 | 1.7 | 3.3 |
South Korea | 439 | 10.4 | 4 | 1.7 | 166 | 9.8 | 37.7 | -1.2 | 0.6 | 2.0 |
Taiwan | 543 | 20.7 | 12.8 | 1.4 | 197 | 28.1 | 36.3 | -0.3 | -1.0 | 0.7 |
India | 598 | 18.1 | -0.9 | 5 | 102 | 3.6 | 17.1 | -1.0 | 4.5 | 2.6 |
Indonesia | 132 | 11.2 | -0.7 | 2.2 | 46 | 4.1 | 34.7 | 1.3 | 4.9 | 5.8 |
Malaysia | 106 | 6.7 | 4.3 | 2.3 | 101 | 27.8 | 95.6 | -0.6 | 1.8 | 2.6 |
Thailand | 236 | 15.5 | 3.7 | 1.2 | 75 | 13.8 | 31.6 | -0.7 | 0.3 | 2.2 |
Philippines | 93 | 12.4 | 1.45 | 4.1 | 12 | 3.3 | 13.3 | -2.1 | 3.1 | 2.1 |
LATAM (average)
|
193
|
12.9
|
0.7
|
4.4
|
49
|
5.3
|
31.4
|
-1.77
|
5.18
|
3.85
|
Brazil | 339 | 23.5 | -0.8 | 5.45 | 75 | 4.1 | 22.1 | -2.0 | 7.5 | 5.1 |
Mexico | 194 | 6.1 | 2.0 | 4.55 | 49 | 3.9 | 25.4 | -0.6 | 5.0 | 3.6 |
Chile | 48 | 9.0 | 0.9 | 3.3 | 22 | 7.9 | 46.5 | -2.8 | 3.0 | 2.8 |
EMEA (average) |
163
|
10.3
|
0.4
|
7.2
|
73
|
10.1
|
113.0
|
-0.30
|
6.28
|
2.18
|
South Africa | 43 | 7.6 | 1.3 | 4.1 | 28 | 7.9 | 63.9 | -0.6 | 7.5 | 6.5 |
Poland | 116 | 6.0 | 3.2 | 3.7 | 62 | 10.5 | 53.6 | -3.6 | 0.4 | -0.2 |
Turkey | 44 | 2.4 | -5.1 | 15.8 | 141 | 18.5 | 321.0 | 3.2 | 16.4 | 3.7 |
Russia | 447 | 25.1 | 2.2 | 5.2 | 60 | 3.5 | 13.3 | -0.2 | 0.9 | -1.2 |
Source: Bloomberg, Hermes analysis, as at 1 June 2021.
EM growth and valuation – valuation not too expensive, supported by growth (2021) in most cases
EM valuation vs. growth:
- Re-rated and growth > EM: India, Indonesia, Korea, and the Philippines
- Re-rated but growth < EM: Thailand, China, and Taiwan
- Cheap vs. history and growth > EM: Chile, Mexico, Brazil, S. Africa, and Turkey
- Cheap vs. history and growth < EM: Malaysia
Figure 10. EM: valuation (standard deviation) vs. EPS CAGR
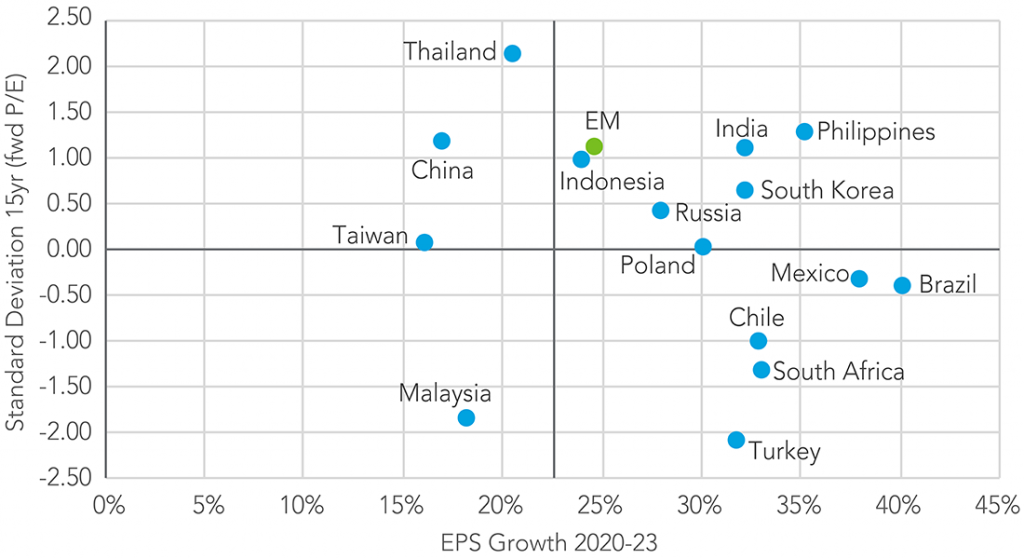
Source: Bloomberg estimates, as of 1 June 2021.
Growth beyond 2021: likely to taper off meaningfully for most markets
Most emerging economies will likely grow by about 30%+ compound annual growth rate (CAGR) between 2020 and 2023 due to the low base effect in 2020. When the low base effect is excluded, only a handful of economies (China, India, Indonesia, Thailand, Philippines, South Africa, and Turkey) will increase by double-digit figures in FY2 and FY3. The prospect for several economies depends on the continuation of commodity price hikes, further opening of economies post lockdown, vaccination rates, and the pace of reform, which will determine sustainable growth in the medium term.
Figure 11. Earnings growth moderating post 2021
EPS CAGR (2020-23) | EPS CAGR (2021-23) | EPS Growth – FY1 | EPS Growth – FY2 | EPS Growth – FY3 | |
|---|---|---|---|---|---|
EM | 25% | 10% | 59% | 10% | 10% |
China | 17% | 16% | 19% | 17% | 16% |
Korea | 32% | 9% | 96% | 9% | 9% |
Taiwan | 16% | 5% | 41% | 3% | 7% |
India | 35% | 13% | 93% | 14% | 13% |
Indonesia | 24% | 23% | 26% | 20% | 26% |
Malaysia | 18% | -4% | 79% | -8% | 0% |
Thailand | 21% | 14% | 36% | 15% | 12% |
Philippines | 32% | 21% | 58% | 28% | 14% |
Brazil | 40% | -4% | 201% | -6% | -3% |
Mexico | 38% | 7% | 130% | 8% | 6% |
Chile | 33% | 11% | 92% | 16% | 6% |
S. Africa | 33% | 16% | 75% | 15% | 18% |
Poland | 30% | 2% | 114% | -2% | 5% |
Turkey | 32% | 17% | 66% | 17% | 18% |
Russia | 28% | 5% | 92% | 5% | 4% |
Source: Bloomberg estimates, as of 1 June 2021.
Country conclusions
- Economists expect the Chinese economy to grow by more than 8% in 2021, driven mainly by a strong export rebound. However, China needs consumption to pick up this year and beyond as the boost from exports will likely begin to fade.
- The Communist Party of China (CPC) is likely to use various policy tools to ensure that the country grows at a steady pace of 5%-6% each year. Given the dominance of the new economy sector in the index, the market expects mid-to-high teen EPS growth over the next three years, despite a slowing credit impulse in the economy.
- Reform is back on the agenda, spanning state-owned enterprises, curbing excesses (internet, property, and credit), and a focus on demography (three-child policy) with social security.
- Geopolitics is a risk, but US President Joe Biden is likely to be pragmatic and focus on military versus trade.
- A positive real rate environment helps the renminbi, but the recent FX reserve requirement ratio (RRR) hike could prevent the currency from appreciating further meaningfully.
- Emerging coronavirus variants is a risk, but China has the capability of coping with outbreaks very well.
- China is a net creditor economy with a high FX reserve level and hence, it is less impacted by upward moves in the US 10-year bond yield.
- Our analysis suggests limited price-to-earnings (PE) de-rating risk. Earnings growth is steady, and FX depreciation is likely to be limited. Regulatory headwinds in the internet sector are known and have been priced in. The regulatory environment is expected to stabilise in the second half of this year. For this reason, we have moved our allocation to Overweight.
- Korea is a key beneficiary of the rebound in global trade.
- It is well established in the semiconductors, memory, and biotech industries – and has a solid export performance.
- Korea had made some progress in governance and the fight against corruption, but more needs to be done. Korea continues to be amongst the lowest-ranked country in the ACGA Corporate Governance Surveys.
- The equity market has re-rated, but it is not unreasonable compared to earnings growth.
- The rise in retail investors and the use of margin financing has risen recently. The ban on short-selling has reversed, increasing the volatility in small and mid-cap stocks.
- Emerging coronavirus variants are a risk, but Korea has a strong ability to cope with outbreaks.
- Korea is a net creditor economy with high FX reserves and hence, it is less impacted by upward moves in the US 10-year bond yield.
- Our analysis suggests limited PE de-rating, a strong earnings rebound in the near term, and minor FX depreciation threats. Korea will benefit from a robust external environment, including a strong rebound in the memory/semiconductor industry. As a result, our country allocation remains Overweight.
- Taiwan is a key beneficiary of the rebound in global trade.
- Taiwan is the most important country from a geo-strategic perspective due to its dominance in advanced semiconductor manufacturing. It is benefitting from the recent global chip shortage which could last until 2022.
- However, Taiwan’s position is at risk due to the threat from China, who is committed to unifying Taiwan with the mainland, as well as recent efforts from the US and European Union (EU) to localise semi-production.
- Equity markets have re-rated; however, growth is likely to be mid-single digit beyond 2021, and margin financing has grown by over 45% so far this year.
- The recent Covid-19 outbreak is a risk if the number of cases escalates, but Taiwan has a strong capability to manage such issues.
- Taiwan is a net creditor economy with high FX reserves. As such, it is less impacted by upward moves in the US 10-year bond yield.
- Our analysis suggests limited PE de-rating. Earnings are stable with a slight FX depreciation. We remain Neutral as its valuation has re-rated over 30% during the past two years, and geopolitical risks are rising. TSMC will have to invest increasingly large sums of money in the US and Europe to satisfy the security of supply issues and mitigate the China risk. The investment phase implies lower returns, while Intel and Samsung are also pursuing a similar strategy, with both having deep pockets. The recent heavy margin financing-led rally is a risk.
- The economy is likely to grow by 9-10% this year (despite the second wave of the coronavirus) and 7-8% in 2022.
- Inflation is moderating after running ahead of the Reserve Bank of India’s band and will cool to 4.5-5.0%.
- In nominal terms, India is likely to offer about US$1tn of incremental opportunity over the next three years compared to US$2tn in China.
- The pace of reform is strong, but implementation is critical, especially for farm laws.
- Elections are also a risk. The general election is in 2024 – and while it is not an imminent cause for concern, the state of Uttar Pradesh (UP) will hold elections to elect the state legislature in 2022, and the outcome of the UP elections will dictate the national narrative. At present, there is no other credible alternative to the BJP at the national level. That said, Prime Minister Modi’s popularity dipped slightly after the recent Covid-19 outbreak.
- The slow pace of vaccinations and the emerging Covid-19 variants are a risk. However, the government is unlikely to impose stringent lockdown that will impact economic activity as the mortality rate is low.
- India is a twin deficit country, and although its share of short-term foreign debt is low, rates are at risk to an upward move in the US 10-year bond yield. Unlike 2013 (when the taper tantrum occurred), India is well prepared with about US$600bn in foreign-exchange reserves to support the rupee, if needed.
- Our analysis suggests about 20% P/E de-rating risk in the absence of RBI intervention if the US 10-year real yield increases to 50bps. We remain Overweight, owing to the strong earnings rebound expected in the near term, followed by the prospect of double-digit growth over the medium term supported by the reform agenda with limited FX depreciation risk.
- Post Covid-19, Indonesia is expected to revert to a growth profile of about 5% per year and earnings are expected to grow 20%+ each year despite the economy not fully recovering from the pandemic shock. Indonesia has low levels of debt in the economy, and FX reserves have grown to US$138bn.
- Like India, Indonesia is reforming its economy, focusing on the ease of doing business via the Omnibus law. The implementation of the reform is vital.
- Inflation is below target, and Indonesia is maintaining a positive real-rate environment.
- Indonesia has a modest current account deficit (due to subdued imports), and the budget deficit has picked up recently, but it is expected to moderate by 2023.
- The current account deficit could pick up in the future as Indonesia depends on coal exports to countries such as China, and decarbonisation will impact future exports. In addition, Indonesia seems to be less focused on climate change and targets to achieve net-zero only by 2070.
- The slow pace of vaccinations and emerging Covid-19 variants are a risk, along with the high level of foreign ownership of Indonesian bonds that are currently offering 560 bps over the US 10-year in real terms.
- Our analysis suggests about 15% P/E de-rating risk. While earnings are likely to grow by about 25% CAGR over the next three years, FX could be at risk due to high foreign ownership of Indonesian bonds. For these reasons, we have reduced our overweight allocation.
- The Russian growth rate of 2-3% will not be enough to help raise the standard of living or provide any meaningful improvement in quality of life.
- Russia has twin challenges: domestic corruption/politics that limits the economic potential; and geopolitics (especially relations with the US) that impact sentiment and currency due to the threat of sanctions.
- Over the medium/longer term, Russia needs a future beyond oil and probably gas too. And so, investment in physical/digital infrastructure is essential to boost the competitiveness of the domestic economy and find new areas for growth.
- While Russia has a prudent macroeconomic situation, in the absence of reform, the prospects are not too bright.
- Our analysis highlights limited PE de-rating. Although the oil markets are buoyant and will support Russian earnings and dividend yields, the long-term case for the country is not clear due to heavy dependence on fossil fuels without any credible diversification plan. Hence, we remain Neutral.
- The Turkish Lira is the worst-performing currency so far this year, losing 15% compared to the dollar, primarily driven by the negative sentiment following the removal of the Central Bank Governor. Three central banks chiefs have been abruptly removed by Erdogan over the last two years, eroding policy credibility and investor confidence.
- Rising oil prices and global inflation is an issue, and the current account deficit is one of the highest in emerging markets, pressuring the currency further.
- Despite the negative sentiment, the economy will likely rebound by 4-5% in 2021. Economists expect the economy to grow by about 4% per annum for the next few years, probably due to quasi-fiscal stimulus measures that will drive private consumption.
- The sustainability of such fiscal measures is a risk as Turkey has a high funding requirement and its dependency on foreign borrowing is out of proportion compared to its FX reserves.
- The rising bond yield environment is a risk for Turkey. Although Turkey offers over 300bps real spread over the US 10-year, the spread could widen further.
- The Turkish market is trading two standard deviations below the long-term average. At 5x P/E, Turkey is the cheapest market in emerging markets, albeit with significant macro vulnerability and challenges. The market has probably discounted the macro/political issues, and the EPS growth of +18.5% per annum beyond 2021 is attractive – but it could be uncertain if it is largely dependent on fiscal stimulus.
- Although the Turkish market is cheap, our analysis suggests that the P/E could further de-rate if US bond yields rise despite a strong earnings rebound (led by banks). Our FX model indicates that the currency is oversold and could appreciate 15-20% – however, we have not considered this in the model. Hence, the earnings growth is entirely offset by PE de-rating, leaving the dividend yield of 6-7%. The expectations are meagre that the Erdogan administration will do anything prudent – and pessimism is already very high. As a result, we maintain a Neutral allocation as the markets/FX could re-rate if there is a favourable policy « U » turn.
- Consumption and exports (of commodities) are critical drivers for the South African economy in 2021. The currency is one of the best performers year-to-date – up 3% compared to the dollar. South Africa offers a positive spread over the US 10-year and exposure to the commodity trade.
- However, beyond the near-term boost from the economy reopening and the commodity rush, it has numerous structural deficiencies – inequality, high unemployment, precarious electricity system, limited fiscal space, and a lack of a strong political will to reform.
- Faster rollout of vaccines and implementing structural reform is vital to ensure a sustained recovery.
- The rising bond yield environment is a risk for South Africa. However, there is a healthy 650bps real spread over the US 10-year.
- The market is trading 1.25 standard deviations below the long-term average despite a strong earnings rebound in 2021 and the continuation of double-digit EPS growth, which is dependent on economic normalisation (vaccine rollout) and commodity prices.
- Our analysis suggests some risk of PE de-rating. However, earnings growth prospects are strong. The currency, however, has scope for further depreciation, according to our FX model. Despite the de-rating and currency volatility, earnings are likely to support the index. Our bond yield model offers the second-highest upside in South Africa. Macro challenges remain given the lack of reform – hence, we maintain our Neutral allocation.
- The economy declined 8% in 2020 and is likely to grow by 5% and 3% in 2021 and 2022, respectively, implying a two-year recovery period from the impact of the Covid-19 pandemic. This compares to most emerging market economies that are recovering well this year.
- Private consumption is recovering gradually, and the economy is benefitting from a boost to exports, and a close connection to the US economy is beneficial for Mexico.
- If global trade accelerates, Mexico will benefit, and job creation will be robust, boosting domestic consumption.
- Latin America is going through political uncertainty, and Mexico is no exception. The Mexican President lost congressional supermajority in recent elections necessary for constitutional reform.
- While Andrés Manuel López Obrador (AMLO) is not corrupt, he has a patchy track record on reforms focusing more on anti-corruption. Poverty has risen from 36% to 45% of the population, and violence continues unabated.
- Mexico is trading roughly in line with its history, as EPS growth estimates are moderate post-2021 boost.
- Our analysis suggests limited PE de-rating risk and a strong earnings rebound. However, political/policy uncertainty could rise in Mexico due to AMLO’s rising disapproval rates. The Mexican economy will benefit from the strength of the US economy. However, this is not a surprise and evident from expectations. Rising policy uncertainty in Mexico could weigh on the sentiment and increase FX volatility. While the external environment is better for Mexico, the internal environment is not so. Hence, we reduced our Overweight allocation.
- There is a renewed optimism around Brazil’s economic prospects after GDP for first quarter of 2021 exceeded expectations. Several economists now expect Brazil to grow by between 5% and 5.5% this year.
- Progress on vaccinations, the opening up of the economy, benefits from commodity exports as well as investment spending are helping the economy.
- However, due to rising inflationary pressures, interest rates have been hiked twice, and fiscal policy remains tight as rising public debt constrains the budgetary situation.
- Brazil’s gross public debt is likely to reach 90% in 2022. Hence, the credibility of public policies is critical to keep attracting foreign capital and limit currency depreciation.
- The social situation continues to remain fragile. However, it is hoped that the implementation of the infrastructure project and rising global demand for commodities will boost the economy.
- Brazilian equities are not expensive compared to history – and compared to the bond yield, they are trading below average. Our analysis suggests limited price-to-earnings (PE) de-rating and the earnings rebound is strong albeit driven by the strength in the commodity market. The Central Bank’s proactive approach to monetary policy tightening likely limits the currency depreciation. The dividend yield is reasonable at about 4%. However, political uncertainty could return in Brazil as Bolsonaro’s approval rating is low, and Lula da Silva could make a political comeback for the 2022 presidential election. The ongoing commodity supercycle will benefit Brazil. As a result, we have increased our weighting to Neutral.
Global Emerging Markets: Country allocation review
Share:
Risk profile
- This document does not constitute a solicitation or offer to any person to buy or sell any related securities or financial instruments.
- The value of investments and income from them may go down as well as up, and you may not get back the original amount invested.
- Past performance is not a reliable indicator of future results and targets are not guaranteed.
- Investments in emerging markets tend to be more volatile than those in mature markets and the value of an investment can move sharply down or up.