The ESG bond market has grown tremendously over the past few years. In 2023, the total value of ESG bonds issued worldwide is expected to grow beyond the US$1tn mark1, as shown in Figure 1. This growth comes after a slower 2022, where fewer corporate bonds were issued and challenging macroeconomic and geopolitical conditions prevailed.
This growth resulted in benefits for both issuers and investors. Issuers improve investor diversification, enhance their reputation, increase access to sources of sustainable financing and attract strong investor demand – which can lead to pricing benefits.
Investors can satisfy sustainability requirements, increase transparency and accountability on the use of proceeds, diversify investments and enjoy comparable financial returns with the addition of sustainable benefits.
Figure 1: Value of ESG bonds expected to exceed US$1tn mark this year

Even though the sector is expanding, the performance of ESG bond funds relative to the rest of the market is still being questioned – despite an ever increasing amount of research showing that, over time, sustainable investment funds can deliver financial returns that are as good as, or better than, traditional investments.2
Some of this research was pioneered by our credit team. In 2017, as part of an effort to analyse credit risks with greater precision, we developed a pricing model3 to capture the influence of environmental, social and governance (ESG) factors on credit spreads. The model indicates that ESG integration contributes to a lower risk profile and that a link between credit risk and ESG performance exists.
Figure 2: Implied credit default swap (CDS) spreads and corresponding QESG scores, 2012-2018
The greater the level of integration of ESG the lower the spread level of a company, indicating a clear path to performance
In this note, we will take a closer look at the performance of our Federated Hermes SDG Engagement High Yield Fund versus the high yield market and relevant ESG indices. But firstly, let’s look into the purpose of the Fund.
The Fund aims to generate long-term, risk-adjusted outperformance by investing in attractive high yield credit instruments and by engaging with companies to generate positive impacts that support the objectives of the UN Sustainable Development Goals (SDGs)4. To achieve this, we combine a global, dynamic investment approach developed by our credit team with the engagement skills of our dedicated engagers within EOS, the stewardship arm of the business.
Figure 3: Investing with co-linear objectives

We combine a global, dynamic investment approach developed by our credit team with the engagement skills of our dedicated engagers within EOS, the stewardship arm of the business.
Assessing a company’s contribution to achieving the SDGs is no easy task and is made more challenging by the nature of some of the companies within the credit universe. The businesses we invest in do not always lead their sector in disclosing how their products, services, operations, or strategic investments will drive positive SDG-related impact. Some impacts that we believe are possible cannot be fully assessed without substantive engagement.
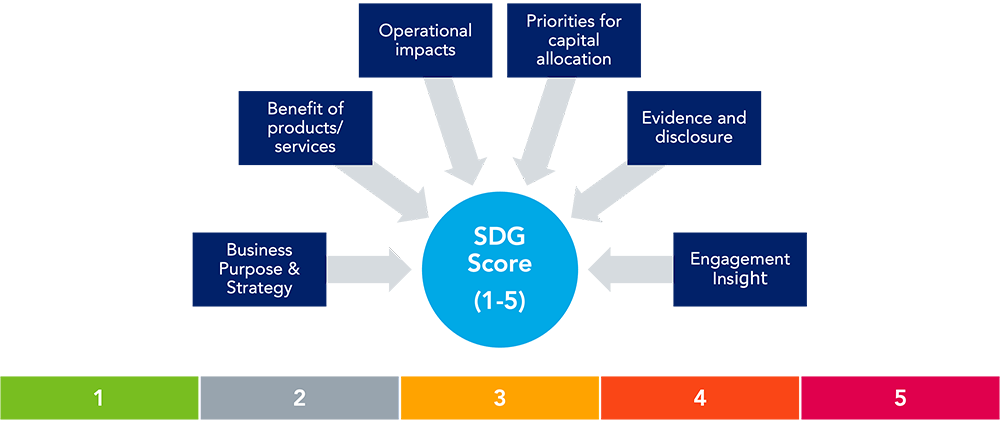
As part of our evaluation process, we assign our own SDG score of one to five to companies within our investment portfolio (with one representing a high likelihood of delivering positive, substantive outcomes in line with one or several SDGs). This score is an important part of our investment approach and helps us decide the overall shape of our portfolio, as shown in Figure 4 below.
Figure 4: SDG-aligned engagement – our six assessment factors
Now, let’s look at the Fund’s performance versus the broad global high yield index and two sustainable indices.
Looking at performance since inception, we can observe that the Fund outperformed the Bloomberg Global High Yield Index5 and, more importantly, that it has outperformed the index approximately 90% of the time during this period. In addition, for a period the Fund materially outperformed the Global High Yield ESG Tilt Index, a modified version of the Global High Yield Index that adjusts security weightings to improve the overall ESG risk score of the index.6
Figure 5: Performance since inception
Comparing the Fund’s performance against all of the above indices, plus the Global High Yield Paris-Aligned Index (an index that takes into account ESG factors, including the exclusion of securities of issuers that do not meet the requirements for inclusion in Paris-aligned benchmarks under EU and UK benchmark regulations) from February 2022 produces similar results, with the Fund mostly outperforming the global high yield market and the two sustainable indices.
Figure 6: The Fund outperformed the global HY market and two sustainable indices
This positive performance is the result of the Fund’s co-linear investment and societal objectives. Instead of aligning the portfolio with decarbonisation, ESG leaders, or backwards-looking ESG data, the Fund aims to exploit valuation anomalies and identify companies with ex-ante potential to affect positive change in the context of the SDGs. Since the start of 2022, the Fund has been overweight in the US and Latin America, regions that added to performance, while the largest overweight in Europe detracted. In addition, the structural underweight of the Fund to B and below-rated companies, which are typically less engageable, added materially to performance. Finally, positive performance can be seen even in sectors where the ICE BofA Global High Yield Paris-Aligned Index has significant differences in weight versus the Bloomberg Global High Yield Index, namely underweights in energy and basics and overweights in banking and media.
Undoubtedly, several forces are driving the economic landscape towards a sustainable future. These include regulatory changes, shifting value chains, and evolving consumer preferences. Corporations that strategically align with this paradigm shift will emerge as winners and investors will not only do good, but also do well.
To find out more about our SDG Engagement High Yield Credit Fund, please explore our capability page.
For further insights on sustainable fixed income, please click here.
1 Source: Bloomberg, data as at July 2023.
2ESG Investing Keeps Pace With Conventional Investing in 2022 | Morningstar, U.S. Sustainable Funds Face Growing Pains in 2022 | Morningstar, Sustainable Investing During Coronavirus | Morgan Stanley
3 QESG scores: Federated Hermes proprietary scores combine specialist ESG research from Sustainalytics, MSCI, Bloomberg, the Carbon Disclosure Project, WRI, and Trucost with fundamental insights gained through in-depth engagements with companies by our stewardship team EOS.
4 Sustainable Development Goals (SDGs): The SDGs are a set of 17 interconnected goals that were adopted by all UN member states in 2015. They are a universal call to action to end poverty, protect the planet and improve the lives and prospects of everyone, everywhere, by 2030.
5 Bloomberg Global High Yield (hedged) Index: This index provides a broad-based measure of the global high yield fixed income markets. Currency exposure is hedged to the US dollar.
6 The Index includes all constituents that are rated by Sustainalytics with a score of greater or equal to 20. Securities are divided into five categories based on the values of their Sustainalytics ESG Risk Scores: Less than 10, Greater than 10 to less than 20, Greater than 20 to less than 30, Greater than 30 to less than 40, and Greater than 40. A weighting adjustment factor is applied to securities in each of the above categories respectively: 2.0, 1.5, 1.0, 0.5 & 0.1.