

Finally?
It has been a tough decade for contrarian, value-biased investors. And we should know. The launch of our Strategy in January 2010 coincided almost exactly with an important peaking of the level of value relative to growth. While for most years since then our performance has been satisfactory, 2020 was disappointing and our Strategy underperformed as value stocks very sharply derated relative to their growth counterparts, leaving us unable to compensate for our stylistic bias by stock picking.
Figure 1. Performance: strategy v benchmark
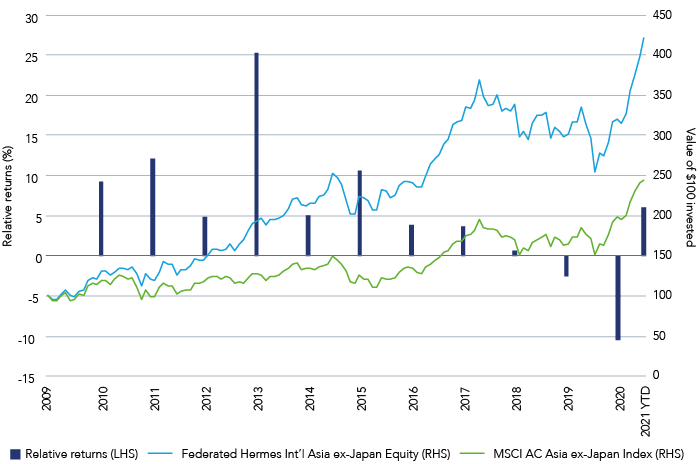
Source: eVestment, Northern Trust, gross of fees, in USD, as at 28 February 2021. Relative returns are calculated geometrically. Past performance is not a reliable indicator of future results.
Composite rolling year performance: Federated Hermes Int'l Asia ex Japan (%)
31/12/19 – 31/12/20 | 31/12/18 – 31/12/19 | 31/12/17 – 31/12/18 | 31/12/16 – 31/12/17 | 31/12/15 – 31/12/16 | |
|---|---|---|---|---|---|
Strategy | 11.91 | 13.88 | -14.45 | 45.74 | 8.25 |
Source: Federated Hermes as at 31 December 2020. Performance is shown for the Federated Hermes Int’l Emerging Markets Asia IMI Equity composite, inception date: 1 January 2010. Returns are in USD, gross of fees. The information shown is supplemental to the GIPS® compliant composite report provided at the end of this post. Past performance is not a reliable indicator of future results
About halfway through 2020, we published a list of some benchmark growth stocks that we considered to be particularly expensive. We explained that, in our view, it would be difficult for investors in such stocks to achieve acceptable returns because, even if the identified companies grew their earnings rapidly, many would likely suffer a multiple derating from a high starting point. For investors in such stocks, we opined that any such derating would likely more than offset compensating growth in earnings, net assets, or dividends.
It is worth examining the subsequent performance of the stocks that we then identified as expensive.
As shown in Figure 2, we were proven wrong in the second half of 2020. Not only did these stocks continue to outperform, they did so convincingly and relentlessly – some more than doubling from their mid-2020 prices. Indeed, an equally-weighted position in our ‘bubble basket’1 outperformed the benchmark index almost every day in 2020 since we published our bearish opinion on what we then thought were already very overvalued stocks – a powerful indicator that in 2020 momentum was an important feature of markets.
An ‘R’?
Since early 2021, however, things seemed to have changed – for now, at least. Expectations by some investors of an end to extraordinarily cheap money (and the speculative excesses that come with it) have caused price movements that hint at a shift. Some of the more frothily-priced stocks have begun to underperform. Some analysts have even begun to whisper the ‘R’ word. Could a long-awaited enduring rotation be in the offing?
Figure 2. Inhale. Exhale.
Stocks identified by our team as expensive in mid-2020 and their subsequent performance
Returns (%) | ||||||
|---|---|---|---|---|---|---|
Theme | Market cap | PE (trailing) | H1 2020 | H2 2020 | 1 Jan- 28Feb 2021 | |
MSCI China | ||||||
Meituan-Class B | Ecommerce | 234 | 184 | 70 | 71 | 15 |
Pinduoduo Inc-Adr | Ecommerce | 169 | Negative | 127 | 108 | -4 |
Kweichow Moutal Co Ltd-A | Balju (hard liqour) | 377 | 55 | 23 | 45 | 7 |
Wuxl Biologics Cayman Inc | Drugs development | 44 | 139 | 44 | 117 | -7 |
Semiconductor Manufacturing | Chinese government tech support | 36 | 34 | 127 | -18 | 13 |
Nio Inc – Adr | Electric battery/cars | 60 | Negative | 92 | 516 | -6 |
Kospi (main benchmark) | ||||||
Samsung Biologics Co Ltd | Covid-19 – drugs | 40 | 191 | 72 | 21 | -12 |
Naver Corporation | Internet | 53 | 55 | 38 | 20 | 24 |
Celltrion Inc | Covid-19 – drugs | 35 | 78 | 63 | 36 | -20 |
Lg Chem Ltd | Electric battery/cars | 55 | 163 | 49 | 87 | -3 |
Kakao Corporation | Internet | 35 | 251 | 68 | 59 | 21 |
Samsung SDI Co Ltd | Electric battery/cars | 39 | 76 | 48 | 87 | 4 |
Kosdaq (tech benchmark) | ||||||
Celltrion Healthcare Co Ltd | Covid-19 – drugs | 17 | 75 | 97 | 75 | -26 |
Celltrion Pharm Inc | Covid-19 – drugs | 5 | 380 | 207 | 122 | -38 |
Seegene Inc | Covid-19 – testing | 3 | 6 | 255 | 89 | -38 |
Alteogen Inc | Covid-19 – drugs | 3 | 212 | 284 | 55 | -30 |
Ecopro Bm Co Ltd | Covid-19 – drugs | 3 | 86 | 119 | 56 | -8 |
MSCI Asean | ||||||
Top Glove Corp Bhd | Medical gloves | 10 | 10 | 229 | 18 | -15 |
Hartalega Holdings Bhd | Medical gloves | 8 | 18 | 128 | -12 | -18 |
Source: Federated Hermes, Bloomberg, as at 28 February 2021. Returns in US dollars. Market capitalisation in US$bn. Past performance is not a reliable indicator of future results. This information does not constitute a solicitation or offer to any person to buy or sell any related securities or financial instruments.
A decade of value underperforming growth, with several intermittent false dawns and a backdrop of central banks that seem determined to keep interest rates low, has made us shy of making short-term predictions. Still, our conviction that we will be proven right has grown, as has our optimism for the alpha opportunity in our Strategy.
Value vs growth: the story behind the chart
The oft repeated chart in Figure 3 shows the extent of the outperformance of growth relative to value.
Figure 3. Asian value vs. growth
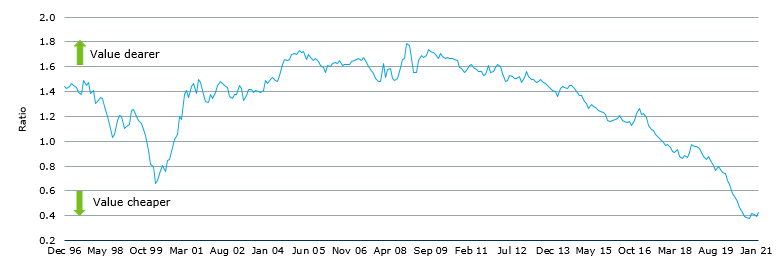
Source: Federated Hermes, Bloomberg as at 28 February 2021. The ticker used for growth is the MSCI Asia ex Japan Growth index and for value is the MSCI Asia ex Japan Value Index.
Looking beyond the time series to the underlying components among growth and value subsegments of the market provides important context. On the growth side, there are clear signs of exuberance. Of course, there is the anecdotal evidence of our own bubble basket inflating parabolically since being adjudged by our team to be expensive. Other evidence includes similar parabolic rises in cryptocurrencies, the Goldman Sachs non-profitable technology stock index and the Goldman Sachs 50 most-shorted stocks index (i.e. those considered by mainly-thoughtful investors with a lot to lose to be expensive), record levels of euphoria in Citibank’s proprietary and long-established ‘panic-euphoria’ index, very low cash holdings of long-only investment managers, massive and sudden inflows into thematic ‘new technology’ funds, obvious market inefficiencies (such as stocks with names similar to popular ones appreciating as they are bought – apparently in error), the proliferation of speculative special purpose acquisition companies (SPACs) – some sponsored by (non-financial) celebrities, a sharp rise in the level of the US microcap index, and an apparent ‘meme’-based retail trading frenzy.2
On the ‘value’ side, despite hints of life, there has thus far been no broad rally (refer figure 3). Strong performance among value names so far seems to be concentrated among those linked to commodity prices and among extremely cheap stocks that have severe operating or financing challenges – perhaps because some investors are taking the view that such stocks have the most to gain from a resumption of economic activity. There has not yet been meaningful outperformance, for example, among higher quality value stocks offering high dividend yields.
Among our own holdings, both our largest contributors and detractors to our Strategy’s performance so far this year have been a mixed bag and include value stocks, growth stocks and stocks which do not easily fall into either of these categories. Many of our value holdings remain cheap or have cheapened. For us, this is a cause for optimism as we continue to expect many of our holdings to re-rate as stocks we do not own derate.
Figure 4. Year-to-date top five contributors and detractors (%)
Return | Relative return contribution | Category | |
|---|---|---|---|
Top five contributors | |||
Kumho petrochemical | 41% | 1.2% | Value held outperforming |
ASE Technology | 28% | 0.9% | Value held outperforming |
Adani Ports | 39% | 0.7% | Neither value nor growth |
Baidu | 31% | 0.6% | Neither value nor growth |
Youngone corp | 28% | 0.5% | Value held outperforming |
Top five detractors | |||
Tencent (not held) | 17% | -0.6% | Growth not held outperforming |
Lotte Fine Chemical | 7% | -0.3% | Value held underperforming |
KB Financial | -3% | -0.2% | Value held underperforming |
Sinopharm | -4% | -0.2% | Value held underperforming |
Samsung Electronics | 0% | -0.2% | Value held underperforming |
Source: Federated Hermes, as at 28 February 2021. Stock names and performance are for a representative fund in our Strategy. Categorisation of stocks as value or growth is based on a subjective assessment by Federated Hermes.
A time for first principles
Many of the stocks that we own happen to be yielding good dividends. Indeed, approximately 34% of our portfolio have dividend yields above 5%. Importantly, we did not buy these stocks solely, or even mainly, because they offered high dividend yields. The high dividend yields are a happy consequence of these stocks being attractively valued on a variety of measures.
To be sure, high dividend stocks are not always attractive. Indeed, in most market conditions, a simple yield-seeking strategy is potentially problematic. This is partly because yield or income funds often bid up such stocks until they are unattractively valued using other bases. But it is mainly because in most market conditions the yield apparently offered by a high dividend-yielding stock is unsustainable. This may be because the company of interest is on peak earnings or the pay-out ratio (the proportion of earnings being paid out) is unsustainably high, or both. This makes the apparently attractive yield on offer fleeting, with the purported yield only being available for one or a few years. Indeed, the very unsustainability of the dividend is often why the stock trades on an apparently high yield – investors are wise to the temporary nature of the pay-out and refuse to bid the stock price up (and apparent yield down) because of this.
For this reason, we have never bought high-yielding stocks simply because they are high yielding. Indeed, an analysis of the history of the yield offered by our Strategy shows that until recently the yield offered by our portfolio was (perhaps non-intuitively given our value bias) consistently below that of the benchmark. Since 2019, however, our yield has exceeded that of the benchmark index and the yield premium of our Strategy relative to the benchmark index is now at a record.
Figure 5. Dividend yield: our Strategy vs the benchmark
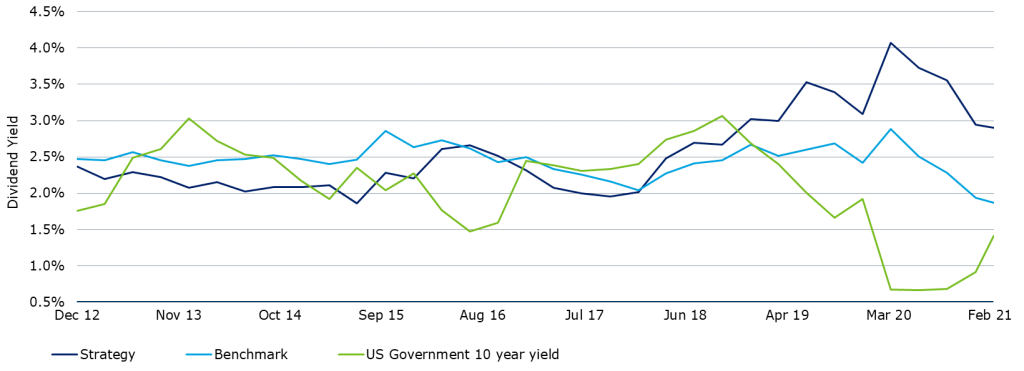
Source: Style Research Analysis as at 28 February 2021. US Government 10-year yield shown to demonstrate the difference in yield and is not a benchmark of the strategy. The benchmark index is the MSCI AC Asia ex-Japan IMI. Past performance is not a reliable indicator of future results.
What makes current market conditions for yield unusual is that there are many companies in diverse industries offering sustainably high yields that in many cases are multiples of the relevant risk-free rate.
We believe that such stocks are available at attractive yields now not because the yields are unsustainable, but because in a world where excitement attracts record premiums, these companies are boring – offering slow growth and unexciting business models. After all, what retail investor or fund manager with impatient clients wants to wait a year to get a 6% dividend yield when the alternative is to buy a non-profitable tech company with a share price that might easily rise 6% in a day?
But buying an expensive stock today that is trading above its intrinsic value in the hope that one can sell it at a higher price tomorrow invokes the spectre of ‘greater fool’ investing3 – the strategy works well as long as you can sell the stock to someone else at a higher price (who must of course believe that they too will be able to do so).
Investing that evaluates the present value of future dividends is the opposite of this. The dividend stream alone is enough compensation for an investor. A holder can own such a stock even if a theoretical future stock market closure meant that they will never be able to find a buyer. This is because such an investor is paid to hold the stock by the company itself and does not need to rely as much on the cash received from the eventual sale of the stock. Indeed, investing in a way that focusses on the present value of future dividends is in some ways a purer form of investing than investing based on an examination of other valuation metrics – such as price-to-book, price-to-earnings, price-to-cash flow, and possibly even (for a non-controlling shareholder) discounted cash flow. This is because these other measures of value are only proxies for the valuation measure that really counts – dividends, or cash flows to be received by investors. Indeed, occasionally investing in companies with even growing earnings that are cheap relative to earnings, cash flow and book value does not mean that an investor will ultimately benefit. This might be the case, for example, among Chinese state-owned companies where government objectives can be prioritised above those of shareholders, resulting in cashflows (otherwise available for dividends) being diverted to low-returning projects.
A particular focus on dividends can be helpful and, for minority shareholders, dividend is often the metric most directly relevant to ultimate shareholder wealth. We might, for example, be persuaded to invest in even a corporate-governance challenged Chinese state-owned company if we can gain conviction that such companies will be able to offer sustainable dividend yields that are already high relative to the current stock price, and unlikely to be arbitrarily cut.
Impact of a rise in inflation rates
Our clients are increasingly asking us how our portfolio might perform if inflation returns. Warren Buffett has expressed the view that companies that have the power to easily pass on greater-than-inflationary price increases to its customers or “an ability to accommodate large dollar volume increases in business (often produced more by inflation than by real growth) with only minor additional investment of capital” would be the most likely to thrive in such an environment, which implies a premium on market power, excess capacity and perhaps the presence of a reliable link between selling prices and margins (for example, in the case of most commodity companies).4 While we have some of these companies in our portfolio, in the short-term, we believe by far the greater impact of rising inflation expectations will be their impact on interest rates. If interest rates begin to rise, we believe this alone would help our relative performance. This is because the ultralow recent interest rate environment has perhaps been the most important single factor behind the exuberance driving the prices of the more speculative stocks in which we are not invested. Predictions of higher interest rates will have a disproportionate negative impact on such companies, allowing our portfolio to benefit relatively. Of course, our higher dividend-yielding stocks might be somewhat less attractive in such an environment because of the more competitive lower-risk returns on offer. However, we expect the impact of rising interest rates on even these stocks to be muted – after all, they have not been helped much by falling interest rates.
It is of course possible that central banks, by buying government securities, will continue to keep interest rates low despite rising inflation. This, however, can only last for so long.
Composite: Federated Hermes Int’l Emerging Markets Asia IMI Equity
Index: MSCI AC Asia Pacific ex Japan (net)
Period Ending: 31-Dec-20
Annualised Returns (%) | |||
|---|---|---|---|
Composite Gross Return |
Index
|
Composite Net Return (Assuming Maximum Fee) | |
Q4 20 | 19.31 | 18.7 | 18.98 |
1 Year | 11.91 | 25.13 | 10.68 |
3 Years (Ann|zd) | 2.92 | 7.56 | 1.79 |
5 Years (Ann|zd) | 11.45 | 12.75 | 10.23 |
10 Years (Ann|zd) | 11.10 | 5.91 | 10.07 |
Jan 10 – Dec 20 (Ann|zd)^^ | 12.78 | 7.11 | 11.79 |
Annual Returns (%) | |||||||||
|---|---|---|---|---|---|---|---|---|---|
Composite Gross Return |
Composite Net Return |
Benchmark Return |
*Composite 3-Yr St Dev |
*Benchmark 3-Yr St Dev |
Number of Portfolios
|
**Dispersion
|
Composite Assets (mil) |
Firm Assets (bill) | |
2011 | -8.83 | -9.27 | -18.62 | N/A | N/A | <5 | N/A | 120.6 | 34.6 |
2012 | 26.58 | 25.92 | 20.74 | 19.61 | 20.76 | <5 | N/A | 153.1 | 33.7 |
2013 | 29.75 | 28.63 | 3.59 | 18.03 | 18.35 | <5 | N/A | 476.6 | 39.4 |
2014 | 9.74 | 8.85 | 4.41 | 13.39 | 13.03 | <5 | N/A | 1,550.0 | 38.9 |
2015 | 1.41 | 0.29 | -8.35 | 14.14 | 13.00 | 5 | N/A | 2,066.3 | 28.0 |
2016 | 8.25 | 7.06 | 4.21 | 14.91 | 14.62 | 5 | N/A | 2,944.3 | 28.9 |
2017 | 45.74 | 44.13 | 40.54 | 15.23 | 14.66 | 5 | 4.52 | 4,807.8 | 34.5 |
2018 | -14.45 | -15.39 | -14.93 | 15.02 | 14.43 | 7 | 0.34 | 4,391.7 | 32.0 |
2019 | 13.88 | 12.62 | 16.91 | 15.00 | 14.36 | 7 | 2.15 | 4,338.3 | 40.2 |
2020 | 11.91 | 10.68 | 25.13 | 19.52 | 18.81 | 6 | 0.98 | 3,220.7 | 585.7 |
^^Represents composite inception period. See below for additional notes to the schedule of rates of return and statistics
*Represents the 3-year annualized standard deviation for both the gross composite and the index returns. Statistic is used to measure the volatility of composite returns.
**Standard deviation is calculated using gross returns. Standard deviation is not applicable (“N/A”) for any period if fewer than five accounts are in the composite for that period.
The composite includes all discretionary portfolios following the Emerging Markets Asia Equity strategy run by the Federated Hermes Int’l Asia ex Japan Equity team and has an inception date of 1 January 2010. The objective of the strategy is to achieve long-term capital appreciation. From February 2016, the investment process evolved to allow the use of partial hedging where allowed by the investment mandate. The benchmark is the MSCI AC Asia ex Japan IMI (net) Index, which is designed to measure the equity market performance of developing and emerging market countries in Asia excluding Japan and covers all investable market capitalization securities. Prior to December 2012 the benchmark was the MSCI Emerging Asia IMI Index. The benchmark is market-cap weighted and rebalanced on a quarterly basis. The return is calculated on a total return basis net of withholding tax. This composite was created in March 2010. Federated Hermes claims compliance with the Global Investment Performance Standards (“GIPS®”) and has prepared and presented this report in compliance with the GIPS® standards. Federated Hermes has been independently verified for the period of January 1, 1992, through September 30, 2020. The verification report is available upon request. A firm that claims compliance with the GIPS® standards must establish policies and procedures for complying with all the applicable requirements of the GIPS® standards. Verification provides assurance on whether the firm’s policies and procedures related to composite and pooled fund maintenance, as well as the calculation, presentation, and distribution of performance, have been designed in compliance with the GIPS® standards and have been implemented on a firm-wide basis. Verification does not provide assurance on the accuracy of any specific performance report. Since inception the management fee schedule for this strategy was 1% per annum for the first USD 25mln, 0.90% per annum for the next USD 50mln, 0.88% per annum for the next USD 25mln, 0.86% per annum for the next USD 50mln, 0.82% per annum for the next USD 50mln and 0.73% per annum thereafter. As of 1 January 2014, the management fee schedule for this strategy was 0.75% per annum. As of 1 November 2014, the management fee schedule for this strategy is 1.10% per annum. Gross of fees returns have been calculated gross of management, custodial fees and reclaimable withholding taxes, but after all trading commissions.
Federated Hermes is a global, independent, multi-strategy investment management firm. For GIPS® purposes, Federated Hermes is defined to include the assets of registered investment companies that are advised or sub-advised by the various Federated Hermes advisory companies. Effective September 30, 2020, for GIPS® purposes the name of the firm was officially changed to Federated Hermes. Firm assets on this report exclude assets affiliated with Hermes GPE and the advisory-only, model-based assets that may be included in other reports providing total firm assets. Interest income and dividends are recognized on an accrual basis. Returns include the reinvestment of all income. All market values and performance information are valued in USD unless currency is denoted in composite description. Annual composite dispersion is measured and presented using the asset weighted standard deviation of the gross returns of all of the portfolios included in the composite over the entire year. Quarterly dispersion is measured using all portfolios included in the composite for that quarter. See the composite description language for a discussion on appropriate fees currently applied to calculate composite performance. Net composite results are based off model fees using the stated fee schedule. In addition, further fee information can be obtained from the firm’s respective Forms ADV Part 2 Brochure Item 5. Additional information regarding the policies for valuing investments, calculating performance, and preparing GIPS reports, as well as a complete list and description of the firm’s composites and pooled funds is available upon request. Past performance is not indicative of future results. GIPS® is a registered trademark of CFA Institute. CFA Institute does not endorse or promote this organization, nor does it warrant the accuracy or quality of the content contained herein. See disclosures on the Schedule of Rates of Return and Statistics Reports for additional information.
Letter to investors
Share:
Risk profile
- The value of investments and income from them may go down as well as up, and you may not get back the original amount invested.
- Investments in emerging markets tend to be more volatile than those in mature markets and the value of an investment can move sharply down or up.
- Any investments overseas may be affected by currency exchange rates.
- Past performance is not a reliable indicator of future results and targets are not guaranteed.
1 A custom basket of stocks that the Asia ex Japan investment team have identified as particularly expensive.
2 Retail investors have been using social media platforms to promote stock ideas often by using very short videos or photos that convey little information about a stock of interest’s investment case, instead often simply predicting that they will rise.
3 The greater fool theory approach to investing, instead of focusing on trying to accurately discern the true, or intrinsic, value of an investment, focuses on simply trying to determine the likelihood that you can sell the investment to someone else for a higher price than what you paid.
4 Source: CNBC, as at 2018.