

Fast reading
- The commodities boom looks set to continue in 2026, following a record-breaking year for precious and industrial metals.
- Further increases in the price of gold are positive for economies with a strong focus on mining or those with substantial stockpiles.
- The growing demand for copper – a crucial element of the electrification megatrend – will benefit major producers including Zambia and Chile.
Emerging market (EM) debt delivered a strong performance in 2025. We expect the continued strength of precious and industrial metals to support further outperformance in select regions in 2026.
EM debt outpaced both developed market debt and the broader fixed income universe over the year. The benchmark JP Morgan EM Global Diversified Index generated double‑digit returns, ending 2025 up 14.3%. Hard‑currency sovereign bonds led with a 14.3% gain, followed by local‑currency bonds at 10.1%, while EM hard‑currency corporates returned 8.7%1.
A combination of structural reforms, supportive monetary policy, and other tailwinds helped drive this performance, as detailed in our previous report. Our Q1 report focuses on the added boost from surging commodity prices – particularly gold and copper – which we believe will remain a key driver of EM resilience and returns in 2026. Which markets do we anticipate as being the primary beneficiaries of the commodities boom?
Gold glitters
Gold delivered exceptional gains last year, driven in no small part by macroeconomic uncertainty and heightened geopolitical risk. In 2025, the gold price underwent a record-breaking run, setting 53 new all‑time highs2 and rising 68% – representing the strongest annual increase since 19793. Total demand exceeded 5,000 tonnes for the first time, while prices surpassed US$5,000 an ounce in January4. This surge was supported by robust central bank buying (Figure 1), ongoing de-dollarisation, and growing global risk aversion amid tariff‑related uncertainty.
Figure 1: Share of gold in official reserves for biggest accumulators
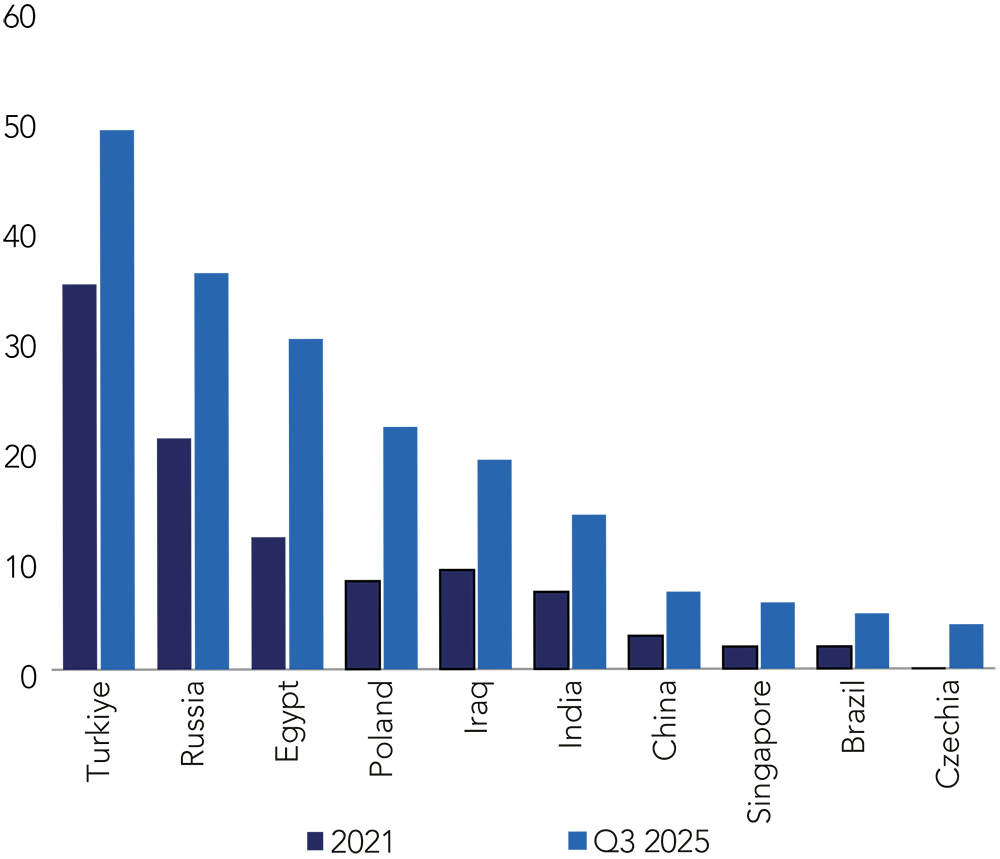
Source: IMF, Haver.
There is reason to believe this momentum may carry into 2026. The conflict in the Middle East led the price of oil to spike in March5, which could potentially spur higher inflation in developed markets6. Gold is often considered an effective hedge in high-inflation environments7, and so the circumstances may lead the price higher. Equally, the conflict may intensify the flight-to-quality dynamic as investors seek out ‘safe haven’ assets amid heightened uncertainty.
A sustained rise in gold prices could significantly strengthen the economic and financial position of many EMs. Those which are major gold exporters – including Ghana and Uzbekistan – see rising prices translate into higher national income. High prices could also influence consumer activity. India, for example, features a lot of collateralised gold lending (Figure 2) which invariably increases in line with the price of gold.
Figure 2: Gold price and percentage of gold loans in India
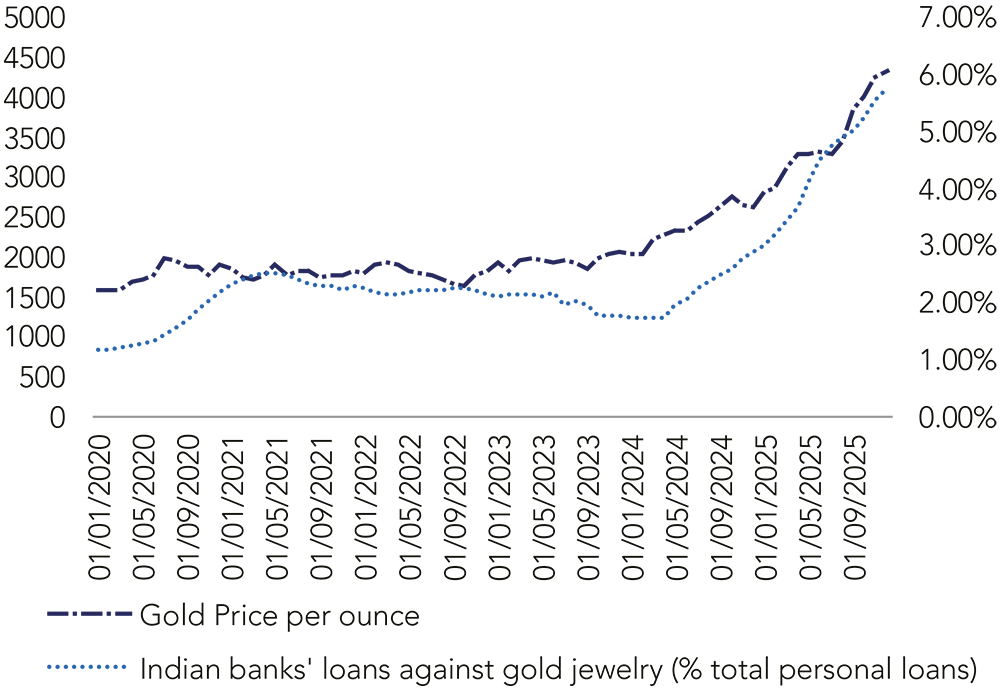
Source: Bloomberg.
Striking copper
Rising copper prices create powerful economic tailwinds for many EM economies – especially major producers such as Chile and Zambia.
Figure 3: Copper demand ramps up
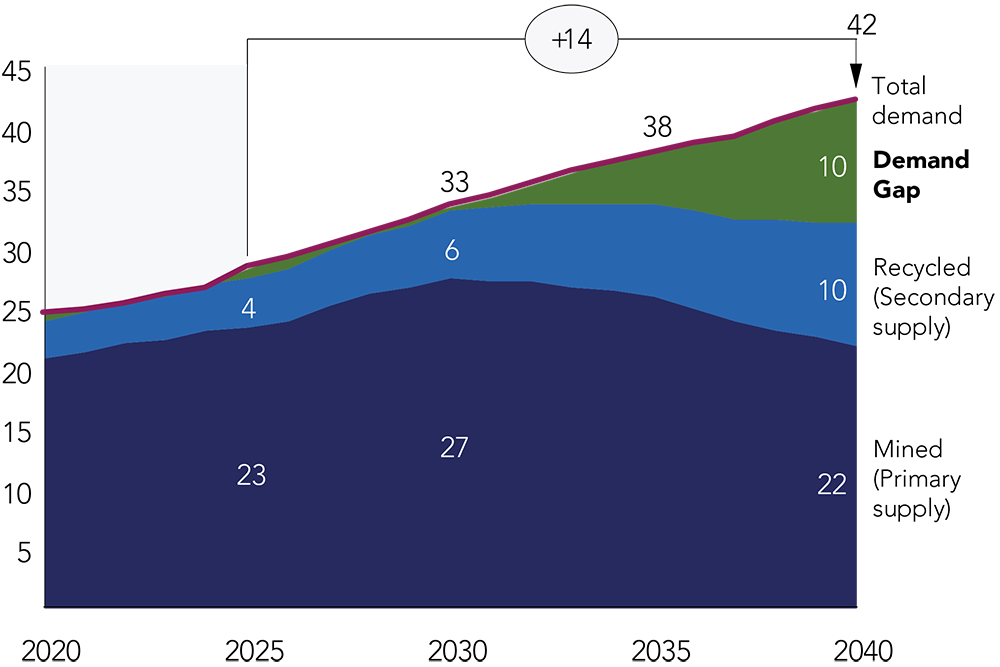
Source: S&P Global.
The price of copper has gone from strength to strength, with the red metal up more than 40% year-over-year to trade over US$13,000 per tonne at the start of February8. Copper is increasingly designated as a ‘critical mineral’ by many countries – including now the US9 – because of its essential role in pivotal industries.
Copper is increasingly designated as a ‘critical mineral’ by many countries.
Demand has surged due to the rapid expansion of AI infrastructure and data centres, as well as growing requirements across medical technology, aerospace, grid modernisation, renewable energy systems, and electric vehicles. These structural drivers have coincided with supportive macro conditions – a weaker US dollar and a lower interest‑rate environment – while the exceptional strength of gold has provided an additional tailwind for copper.
Its importance in supporting these large‑scale shifts is evident in global demand projections: copper consumption reached 28 million metric tonnes in 2025 and is expected to rise by 50%, reaching 42 million metric tonnes by 204010.
Global demand for refined copper is projected to grow at a compound annual growth rate (CAGR) of around 2.8%, rising from 26.6 million tonnes in 2024 to approximately 31.4 million tonnes by 2030. In contrast, global supply is expected to expand more slowly, at a CAGR of 2.41%, increasing from 26.6 million tonnes in 2024 to 31 million tonnes by 203011.
Who benefits from this trend?
Ghana
Ghana, Africa’s largest gold exporter, has been a major beneficiary of the surge in global gold prices. In 2025, gold export earnings rose sharply to US$20bn – almost double the 2024 level – making gold the dominant driver of export receipts12.
This momentum contributed to Ghana closing 2025 with record total export earnings of US$31.1bn, up from US$19.1bn in 2024, according to data from the Bank of Ghana13. The World Bank has recently upgraded Ghana’s 2025 growth forecast to 4.3% (from 3.9%), and is projecting further improvement to 4.8% in 2026. Higer export revenues stemming from the rising price of gold have helped strengthen the country’s currency. The Ghanaian cedi appreciated by more than 20% over the first eight months of 2025, after weakening by 19% in 202414.
However, both the World Bank and IMF caution that fragile investor sentiment and transparency concerns – particularly around initiatives such as the Gold‑for‑Reserves programme15 – remain important risks. Despite this, Ghana has made notable progress since the 2022 economic crisis: GDP growth rebounded from 2.9% in 2023 to 5.7% in 202416, and inflation has moderated substantially from a peak of 54% in late 2022 to 22.4% by March 2025 under an IMF‑supported stabilisation programme.
Figure 4: Ghana gold exports
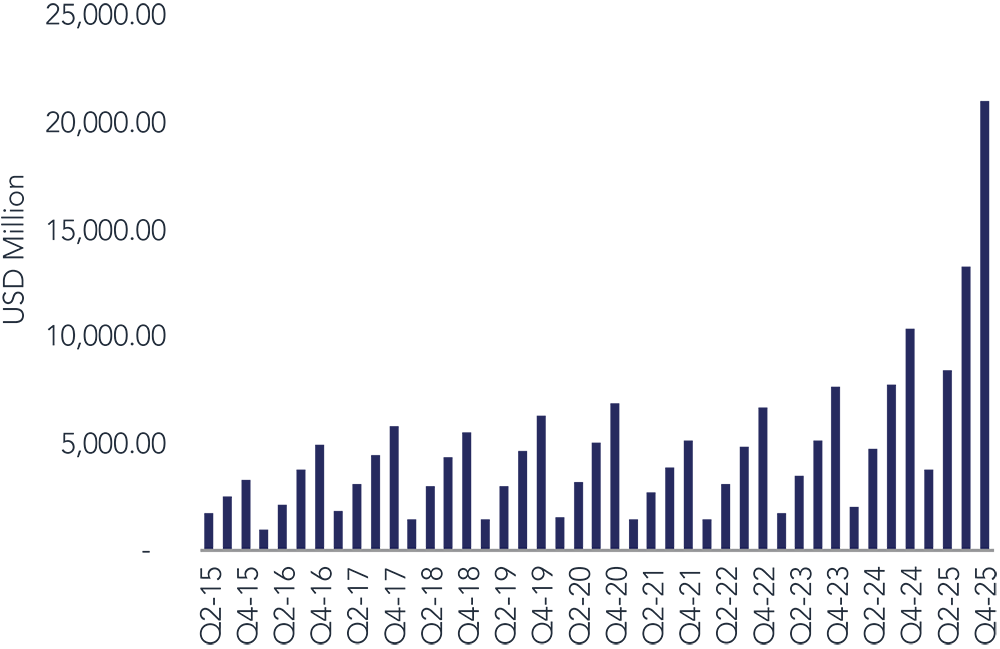
Source: Bloomberg.
Zambia
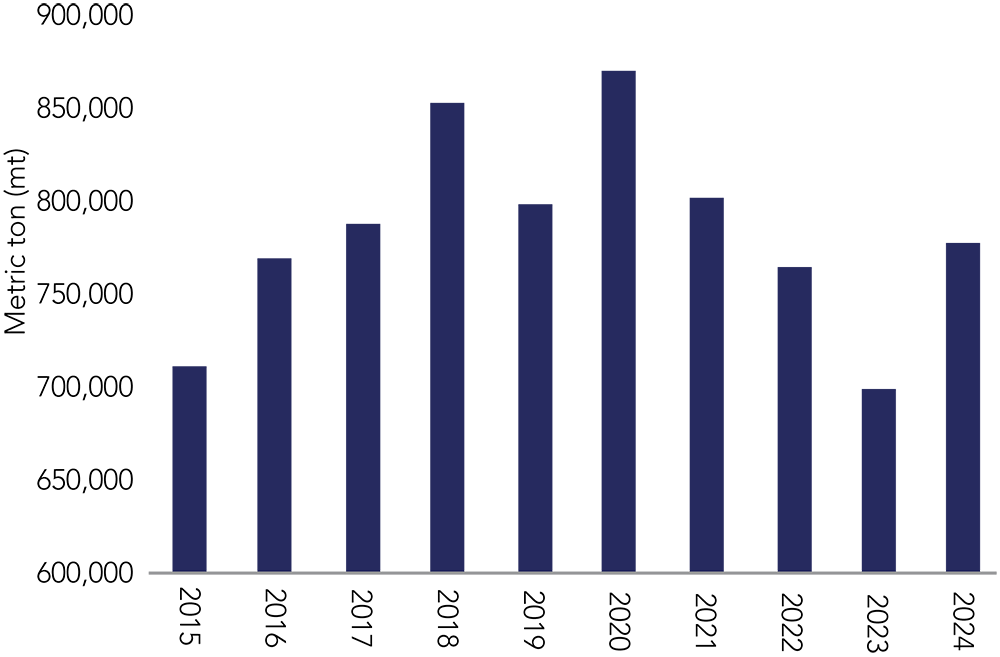
Zambia – Africa’s second‑largest copper producer – finds itself at a crucial juncture. The country is emerging from drought, advancing debt‑restructuring efforts, and implementing reforms aimed at stabilising macroeconomic conditions. The IMF expects real GDP growth to accelerate in the coming years, supported by a rebound in mining – particularly copper – alongside improvements in agriculture and continued expansion of the services sector. Growth is projected to reach between 6 and 8% by 202717. However, elevated public debt, climate vulnerability, and a heavy reliance on copper leave the economy exposed to ongoing risks.
After decades of volatility following the collapse of the 1970s, copper production has shown signs of revival. The sector remains central to Zambia’s economic framework: it contributes roughly 14% of GDP, accounts for 70% of export receipts, and generates between 20-25% of government revenue18. Despite electricity shortages in 2024, copper production in Zambia grew by 12% to 820,676 tonnes19.
Favourable market conditions in 2025 further accelerated production, with output rising 17.8% year‑on‑year in the first half. Looking ahead, the government intends to raise annual copper production to 3 million tonnes by 2031, supported by substantial planned investments20.
Nonetheless, Zambia remains vulnerable to climate shocks. The severe drought of 2024 affected agriculture – much of which is rain‑fed – and hydro‑dependent electricity supply. Even so, the impact was less significant than initially feared, and the economy is now recovering.
Figure 5: Zambia’s recovering copper production
Source: CitiBank.
Chile
One of the principle beneficiaries of elevated copper prices is Chile, the world’s largest copper producer. The country currently accounts for nearly 25% of global output, a share expected to rise to around 27% over the next decade21. Chile’s copper industry is supported by geological abundance, a strong regulatory environment, and a stable, open economic framework. Copper represents roughly 12% of national GDP and about 57% of total exports22. In 2024, total mining production reached roughly 5.5 million tonnes, with about 70% produced by private companies and 30% by state‑owned Codelco23.
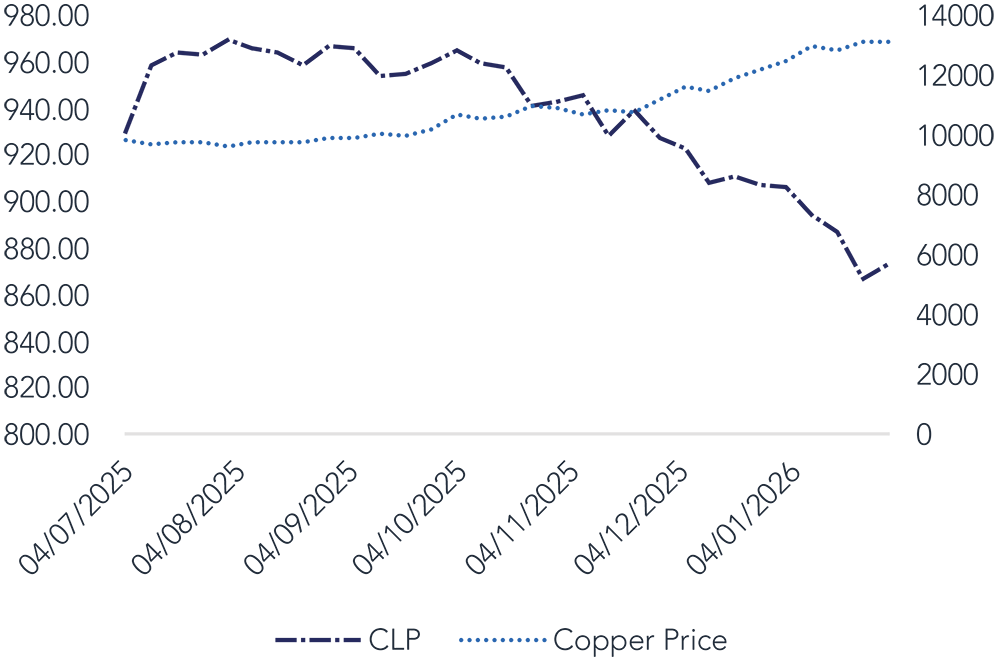
The deep linkage between Chile’s economy and copper is further reflected in the performance of the Chilean peso (CLP). By early February 2026, the peso had appreciated approximately 12.6% year‑on‑year, with a year‑to‑date gain of 4.1% – closely tracking copper’s 5.9% rise over the same period (Figure 6). We anticipate further upside for the currency as robust copper prices persist, supported by the pro‑business, growth‑oriented policies of President‑elect Jose Antonio Kast.
Figure 6: Copper fuelling peso strength
Source: Bloomberg.
Uzbekistan
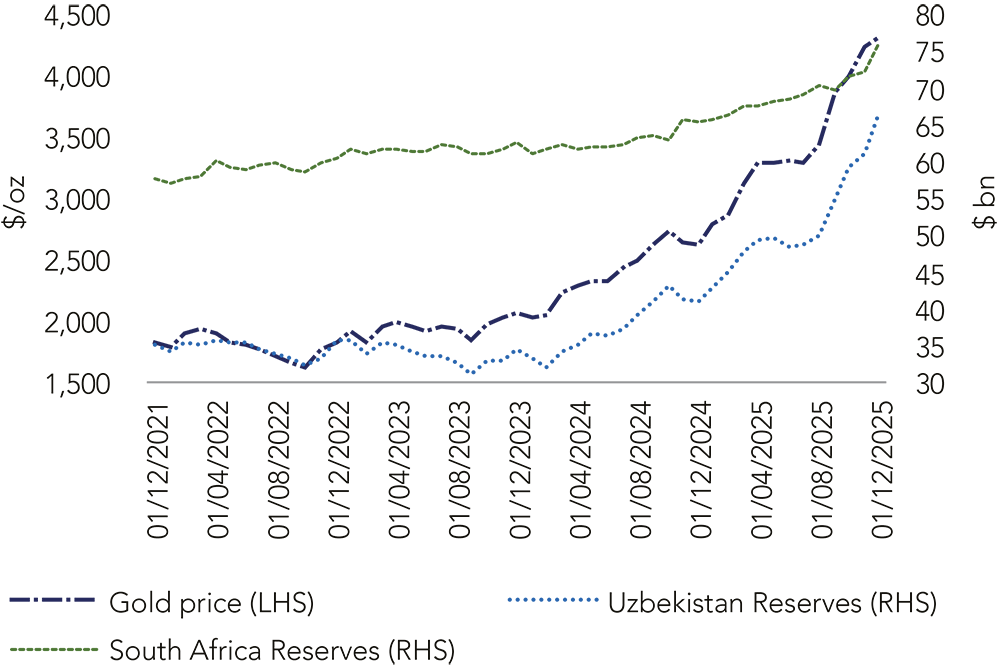
Uzbekistan has been a notable beneficiary of the surge in global gold prices. The mining sector accounts for around 20% of national GDP, with gold playing a central role. As one of the world’s top four gold producers – and among those with the lowest all‑in sustaining costs – the country has seen substantial gains from higher prices. Rising gold revenues have supported fiscal performance, boosted consumption and exports, and lifted GDP growth to over 7% in 202524. The stronger gold price also contributed to lower inflation through an appreciation of the national currency.
The most significant impact, however, has been on Uzbekistan’s external position. With the majority of its international reserves held in gold, the gold price increase – combined with stronger remittances and foreign direct investment (FDI) – increased reserves by more than US$30bn25. By the end of 2025, international reserves reached US$66bn, comfortably exceeding the country’s US$50bn in external debt2627. Together with ongoing reform momentum, these developments strengthen our constructive outlook on Uzbekistan. We prefer to express this view through the bonds of the state gold miner and select banks.
Figure 7: Uzbekistan – a bullion beneficiary
Source: IMF, central banks, Bloomberg.
Turkey
Turkey holds the sixth‑largest gold reserves in the world. A longstanding vulnerability, however, stems from persistently low foreign‑exchange reserves. As a non–dollar‑producing economy that imports far more than it exports, Turkey faces balance‑of‑payments pressures and recurrent current‑account deficits.
Holding a substantial share of reserves in gold has therefore been strategically important, and the sharp increase in gold prices has delivered a meaningful wealth effect for Turkey’s reserve position.
The soaring value of gold contributed half of the increase in Turkey’s gross foreign exchange reserves since the beginning of 202628. Turkey’s gross FX reserves rose to US$215.5bn in January. Of that increase, US$16.2bn was likely due to the rally in gold prices29.
Figure 8: Turkey has one of the world’s largest gold reserves
Country | Region | Economic grouping | FX reserves | Total reserves | Gold reserves Tonnes | Gold reserves Millions | Holdings % |
|---|---|---|---|---|---|---|---|
Italy | Western Europe | High income | 89,426.82 | 433,740.49 | 2,451.87 | 344,313.67 | 79.38 |
Russian Federation | Central and Eastern Europe | High income | AWAITED | AWAITED | 2,326.52 | 326,711.44 | AWAITED |
China | East Asia | Upper middle income | 3,424,872.00 | 3,748,744.37 | 2,306.30 | 323,872.37 | 8.64 |
India | South Asia | Lower middle income | 583,290.00 | 706,892.13 | 880.17 | 123,602.13 | 17.49 |
Japan | East Asia | High income | 1,252,027.17 | 1,370,826.44 | 845.97 | 118,799.27 | 8.67 |
Turkey | Central and Eastern Europe | Upper middle income | 71,558.99 | 157,740.35 | 613.7 | 86,181.36 | 54.63 |
Source: World Gold Council.
Conclusion
The robust performance of gold and copper – including record highs, structural demand, and intensifying central bank accumulation – has created a powerful macroeconomic tailwind for emerging markets. The surge in metal prices strengthens exports, fiscal revenues, currency stability, and investment conditions. Coupled with long‑term structural demand for metals tied to the energy transition and technological growth, these commodity dynamics significantly reinforce their economic outlook and enhance resilience in an uncertain global environment.
EMD report Q1 2026
1 Source: Federated Hermes.
2 Gold Demand Trends: Q4 and Full Year 2025 | World Gold Council
3 Gold and silver hit records as investors hunt for safety – BBC News
4 Gold council
5 Energy – Bloomberg – Bloomberg Markets
6 Middle East Conflict: Macroeconomic impacts of Rising Oil and Gas Prices – NIESR
8 LME Copper | London Metal Exchange
9 usgs.gov/programs/mineral-resources-program/science/about-2025-list-critical-minerals#science
10 Copper in the Age of AI: Challenges of Electrification | S&P Global
13 ibid
14 content
16 Ghana’s Economy Shows Resilience Amid a Challenging Environment
17 IMF Executive Board Completes Sixth Review Under the Extended Credit Facility with Zambia
18 Zambia Foreign Currency Ratings Raised To ‚CCC+/C | S&P Global Ratings
19 2025 Mining Report – Draft 8
22 Ibid
23 Ibid
24 INVEXI: Investment Consulting Management Company
27 Iqtisodiyot va moliya vazirligi
28 Source: Bloomberg
29 Ibid
BD017353