


The fixed-income universe is increasing in size and complexity, necessitating a flexible approach to investment. Following credit-allocation decisions – where an investor determines which regions, sectors and markets offer attractive opportunities across the global credit spectrum – the intensive work of company and security selection begins.
This is when convictions come to the fore.
Questions of conviction
Fundamental credit analysis enables an active investor to determine whether a company’s characteristics – the strength of its operations, balance sheet, enterprise value, cash flow, leadership and management of environmental, social and governance (ESG) risks – make it a leading candidate for investment.
An investor must then look beyond the business and focus on how they can best invest. Analysing the various debt instruments in its capital structure, they should ask: is the spread, or margin, on any bond, loan or hybrid instrument more attractive than on others? Are there derivatives, such as credit-default swaps (CDSs), that offer a better risk-reward balance. Which security provides superior relative value?
The answers should be decisive: how strong they believe the company to be, its performance prospects given the sector and region it operates in, and the potential return of the specific instrument they have invested in relative to others in the same capital structure. An active investor’s ultimate judgement – the outcome of top-down allocation and bottom-up analyses – is their conviction.
Conviction: six drivers for credit investors
Click on the graphic below to explore the drivers
Curve: vertical limit
Credit curves depict the market’s interpretation about the riskiness of an issuer’s instruments. Generally speaking, risk and reward increase as the curve progresses further into the future – although its slope can steepen dramatically or invert to reflect investors’ expectations about the performance prospects for a particular issuer.
As lenders, we typically expect a greater return for investing in instruments dated further along the curve. For active investors, identifying the section of the curve offering the most attractive risk-return prospects is crucial, because focusing only on the headline yield neglects the roll-down, or the capital return realised as a maturing bond converges to par over the next year. Targeting yield alone, therefore, is not always conducive to striking the right balance between risk and return in across their portfolios. For example, the one-year returns from two instruments with the same yield can vary depending on the steepness of the issuers’ credit curves and their roll-down returns, all else being equal.
Case study: Anglo American
We favour resources company Anglo American due to its conservative capital-allocation policy, diversified asset base and strong track record in operating throughout a weak macroeconomic environment. But which of its outstanding bonds offers the most attractive return over a one-year horizon? According to its credit curve, the 2029 sterling bond provides the most rewarding roll-down return (see figure 1).
Figure 1. Anglo American: curve and currency considerations
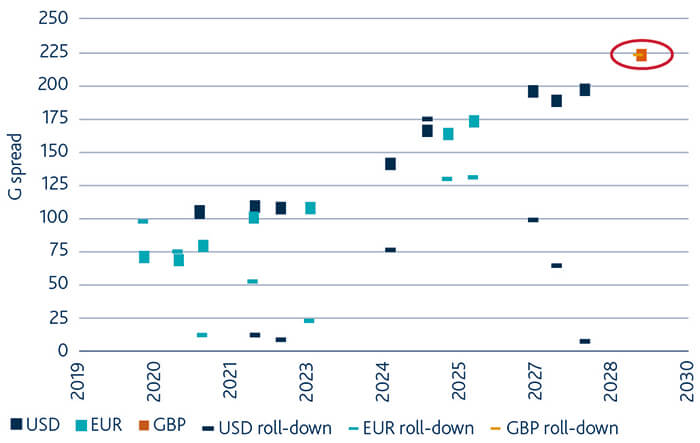
Source: Bloomberg as at November 2019.
Convexity: balancing upside and downside
A call feature, which is common in bond structures, allows an issuer to redeem their bond at a predetermined date and price. This can benefit businesses by enabling them to lower their cost of funding in favourable market conditions, but can be challenging for investors: a call effectively caps the extent to which a bond can appreciate in value. This performance-limiting phenomenon is known as negative convexity.
For example, if a bond is callable in the near future and is trading close to or above its call price, it offers either little upside if the call is triggered or potential losses if performance deteriorates. If exercised, a call limits capital appreciation. For example, an issuing company could be acquired by a more highly rated competitor, which then exercises the call option to refinance at much lower rates, limiting the upside for the bond investors. In addition, investors still face the risk that the company will issue more debt to finance a dividend recapitalisation – a creditor-unfriendly action.
Credit fund managers need to monitor the percentage of bonds they own which are trading above call prices in order to improve the convexity profile of their portfolio. This can be enhanced by analysing the differences between the yield-to-maturity and yield-to-worst of instruments according to region, rating and sector.
Case study: Ardagh
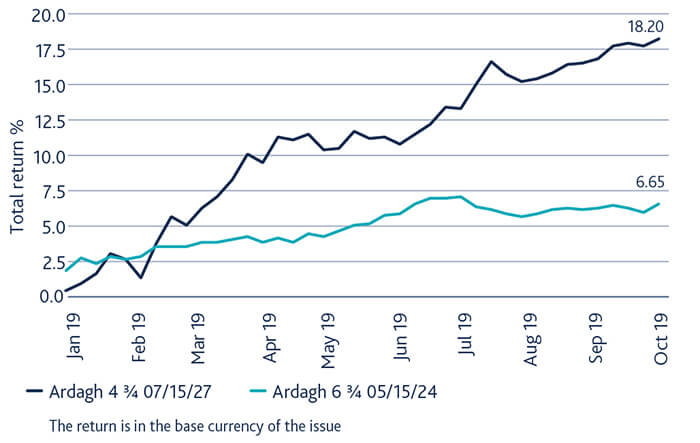
When searching throughout capital structures, we naturally favour instruments with positive convexity and were encouraged by the opportunities available in early 2019. With the volatility of the preceding months still fresh in investors’ minds, the average price of cash bonds had fallen to 92 and a record-low number of bonds traded below their call prices, convexity was widespread and potent. We aimed to invest in bonds with the strongest potential to outperform in a market turnaround, and which were issued by fundamentally attractive companies. One of these businesses was global packaging company Ardagh.
After researching its capital structure, we focused on two of its bonds: the sterling 2027 and the euro 2024 instruments. We chose the former, given its lower cash price and better convexity profile – its call date was three years further into the future. We benefited from its subsequent outperformance during 2019 (see figure 2).
Figure 2. Superior convexity in action: Ardagh’s 2027 sterling bond
CDS: basis effects
Selling a CDS on an issuer, a derivative insuring the buyer from the risk of a company defaulting, can provide a number of advantages.
- First, a CDS is a purer representation of an issuer’s credit risk because the instrument is immune to interest-rate movements. In contrast, the total return from any bond will, to an extent, depend on changes in rates – which are outside of the control of issuer or investor.
- Second, a CDS does not have embedded call features, enabling investors to avoid negative convexity among bonds in rallying markets (see previous section, “Convexity: balancing upside and downside”).
- Third, investors in CDSs can pick and choose the points on an issuer’s credit curve that seem to be the most attractive (see pervious section: “Curve: vertical limit”). This provides opportunities to maximise total returns.
Analysing the risk-return trade-offs among instruments in an issuer’s capital structure is core to our flexible approach to credit investing: choosing which securities are superior is our expression of conviction. When comparing the basis, or relative value between a company’s bond with the relevant CDS, we not only consider differences in maturity and seniority but also the convexity of the bond and the steepness of the issuer’s curve. As figure 3 shows, the attractiveness of buying CDS on US utilities firm Calpine compared to its bonds has changed over time. This dynamic offered an opportunity for investors to earn a greater return through adept security selection given the changes in the basis.
Figure 3. Basis lines: the superior relative value of a five-year CDS on Calpine compared to the company’s 2026 bond
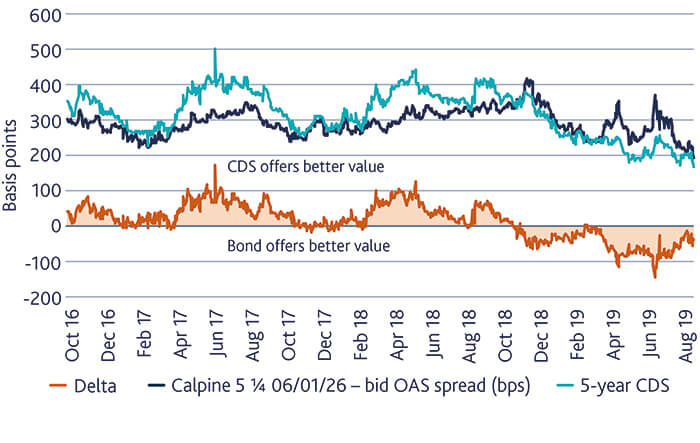
Source: Bloomberg as at November 2019.
Instruments: hybrids on song
The market for corporate hybrids, securities with equity and bond characteristics that are subordinate to senior bonds in a capital structure, has grown quickly in the past five years. Both issuers and investors are attracted to the market for different reasons.
For issuers, hybrids help to diversify their sources of funding, optimise their weighted average cost of capital, and improve balance-sheet strength and flexibility given that ratings agencies view the instruments as part debt, part equity. For investors, hybrids provide an opportunity to gain exposure to attractive corporate fundamentals and earn a return exceeding what is offered through senior bonds.
In the later parts of a credit cycle, amid rising defaults, some investors prefer to select instruments further down the capital structures of stronger issuers rather than invest in more senior securities of weaker companies at risk of not repaying their debt. Investors in the subordinated instruments should not only understand the risks endemic in adverse market conditions – such as extension risk, where issuers defer repayments, due to market conditions, and coupon cancellations – but also the incentives that serve to mitigate them. These include: the presence of a dividend stopper, which prevents the company from making distributions to shareholders unless the coupon on the hybrid is paid; the motivation to call the instrument in order to be seen in a more favourable light by ratings agencies; and whether the deferred coupons are cumulative, where skipped payments must still be paid if equity dividends resume, or, compounding, where interest is still paid on missed coupons, or both.
Case study: Enbridge
Comparing hybrid and senior securities involves analysing the relative value between three instruments: a hybrid, senior bonds with maturities similar to their first call date, and the longest dated security in the capital structure, of ideally 30 years or more. Deciding which one is most attractive depends on an investor’s judgement about which instruments will be called or not.
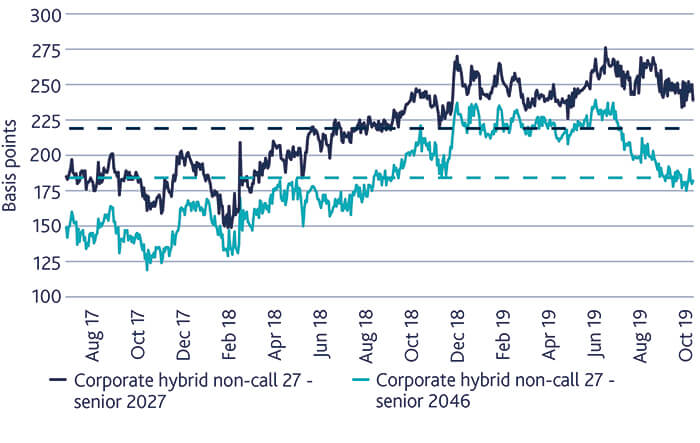
Enbridge, a Canadian oil and gas company, provides a good example. Its hybrid, which is callable in 2027, offers a spread of 240bps versus the shorter dated 2027 bond and 175bps in comparison to the longer dated 2046 senior bond. Given our positive fundamental view on the credit, we think it will be called and therefore put more stock in its valuation versus the 2027 bond or the 2046 bond.
Figure 4. Incoming call
Sustainability: due credit to ESG risk
Sizing: disciplining conviction
To fully express conviction in a credit instrument, the size of the position in a portfolio must be determined. To do this, we consider a range of factors, such as credit quality, country-risk premia, sector cyclicality, and the liquidity and expected volatility of the security. Our objective is for the investment to help diversify the sources of alpha in our portfolio and therefore minimise the risk of any particular security causing too much volatility on day-to-day basis.
To size a position, we use a metric called duration times spread, which gauges the contribution of a particular security to the overall volatility of a portfolio. This can then be used to assess the influence of top-down and bottom-up exposures, from regions, ratings, sectors, instrument type and curve positioning to make sure that no single risk factor is impacting portfolio to an outsized degree, thereby diversifying the sources of alpha.
Destination conviction
Conviction is expressed as a fund manager’s decision to invest or not – and if so, to what extent? But this pivotal view is the sum of many choices involved in company and security selection. From curve, convexity, basis and instrument type to sustainability and sizing, there are numerous drivers of conviction.
As credit markets continue to increase in size and complexity, so do opportunities for active investors to outperform. But whether they consistently do so depends on the quality of their analysis and insights – and, importantly, their flexibility to search across markets, regions, sectors and throughout capital structures to identify instruments with the best performance prospects.
Share:
Past performance is not a reliable indicator of future results.
The value of investments and income from them may go down as well as up, and you may not get back the original amount invested.
Targets cannot be guaranteed.
It should be noted that any investments overseas may be affected by currency exchange rates.
This information does not constitute a solicitation or offer to any person to buy or sell any related securities or financial instruments.
Where the strategy invests in debt instruments (such as bonds) there is a risk that the entity who issues the contract will not be able to repay the debt or to pay the interest on the debt. If this happens then the value of the strategy may vary sharply and may result in loss. The strategy makes extensive use of Financial Derivative Instruments (FDIs), the value of which depends on the performance of an underlying asset. Small changes in the price of that asset may cause larger changes in the value of the FDIs, increasing either potential gain or loss.